 At present, the Technology sector is rotating through the weakening quadrant on the Relative Rotation Graph. Following a strong move in the first months of this year, relative strength for XLK started to level off and has remained more or less flat since April. We'll have to wait and see if the sector can pull off a rotation back to leading without first hitting the left side of the RRG canvas.
The rotations for the individual stocks in the Technology sector are showing big differences, varying from very strong (like MSI and SNPS) to very weak (like NVDA and NTAP).
StockCharts.com subscribers can see the dynamic rotation of the pre-populated universe of Technology stocks against XLK here.
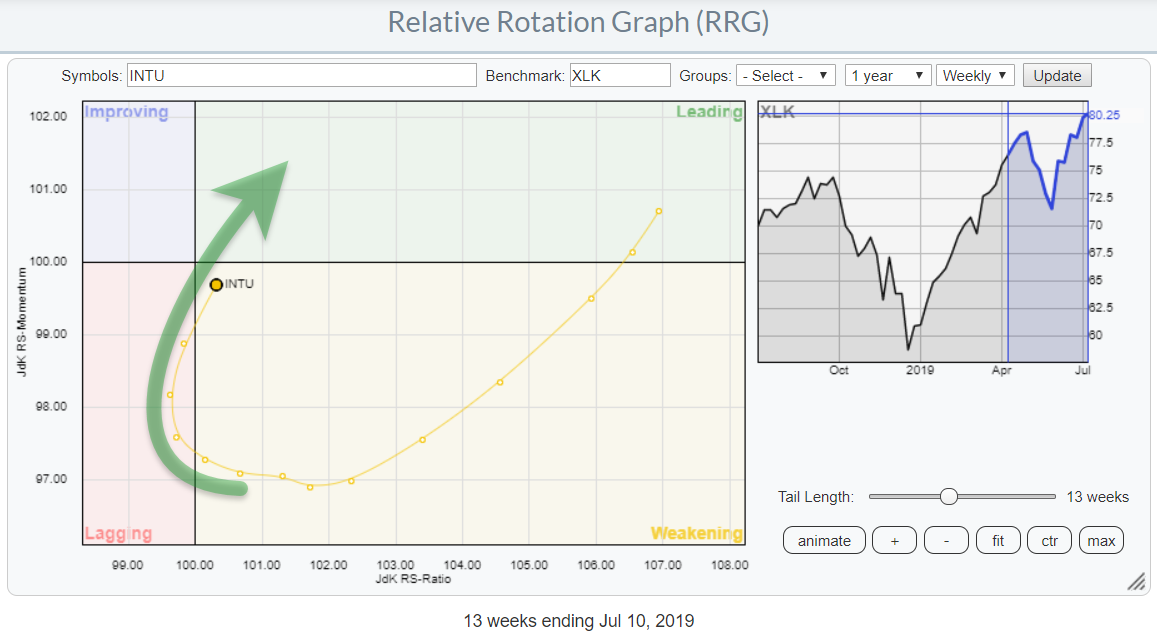
While I was browsing over the Relative Rotation Graph for the Technology universe I noticed an interesting rotation for Intuit Inc. (INTU)...
 This stock entered the leading quadrant in the middle of 2017, when both RRG-Lines crossed above the 100-level. The JdK RS-Ratio line never crossed back until three weeks ago. The JdK RS-Momentum line dipped below 100 a few times, causing rotations through weakening and back up into the leading quadrant when RS-Momentum comes back above 100. These are the characteristics of a strong relative trend, where every rotation from weakening into leading marks the start of a new up-leg in that longer-term trend.
The rotation through lagging was very short-lived, merely marking another pause/correction in the ongoing relative uptrend. The tail immediately started to rotate back into a strong RRG-Heading, coming back into the weakening quadrant without ever hitting improving.
It only seems a matter of time before INTU enters the leading quadrant again.
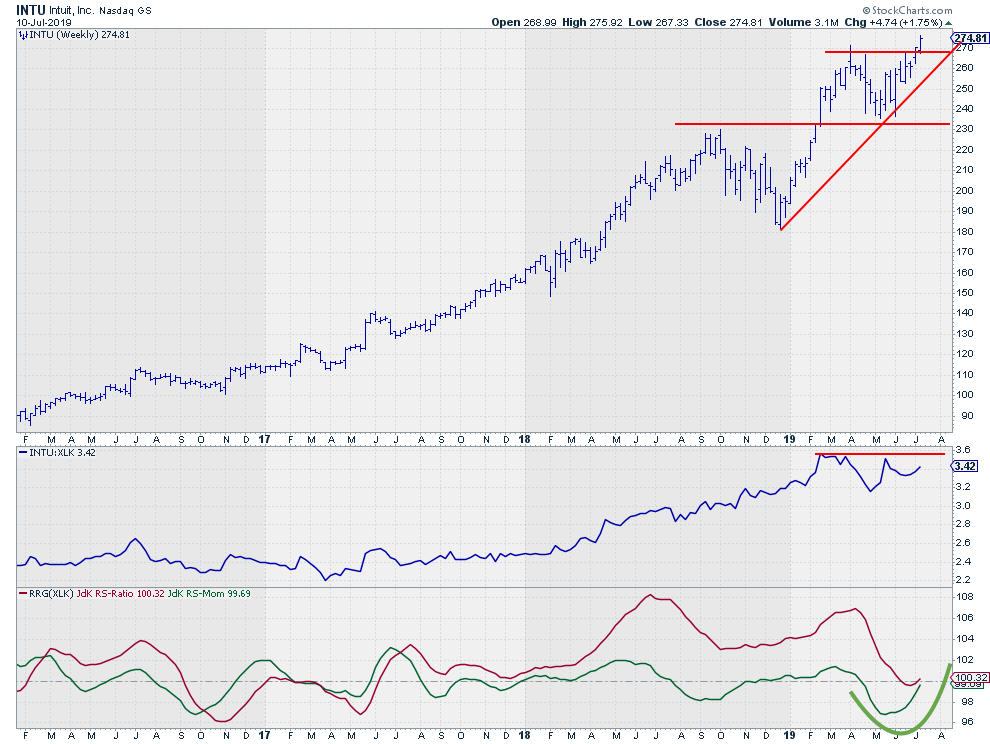
The support for such a move comes from the price chart, where INTU is breaking above its prior high. This opens up the way for (much) more upside potential, while the downside is protected by the old resistance level (which has turned into support).
This killer combination of a break to new highs on the price chart and a strong rotation back to the leading quadrant on the RRG makes INTU a stock well worth watching in coming days/weeks.
My regular blog is the RRG Charts blog. If you would like to receive a notification when a new article is published there, simply "Subscribe" with your email address.
Julius de Kempenaer
Senior Technical Analyst, StockCharts.com
Creator, Relative Rotation Graphs
Founder, RRG Research
Want to stay up to date with the latest market insights from Julius?
– Follow @RRGResearch on Twitter
– Like RRG Research on Facebook
– Follow RRG Research on LinkedIn
– Subscribe to the RRG Charts blog on StockCharts
Feedback, comments or questions are welcome at Juliusdk@stockcharts.com. I cannot promise to respond to each and every message, but I will certainly read them and, where reasonably possible, use the feedback and comments or answer questions.
To discuss RRG with me on S.C.A.N., tag me using the handle Julius_RRG.
RRG, Relative Rotation Graphs, JdK RS-Ratio, and JdK RS-Momentum are registered trademarks of RRG Research.
