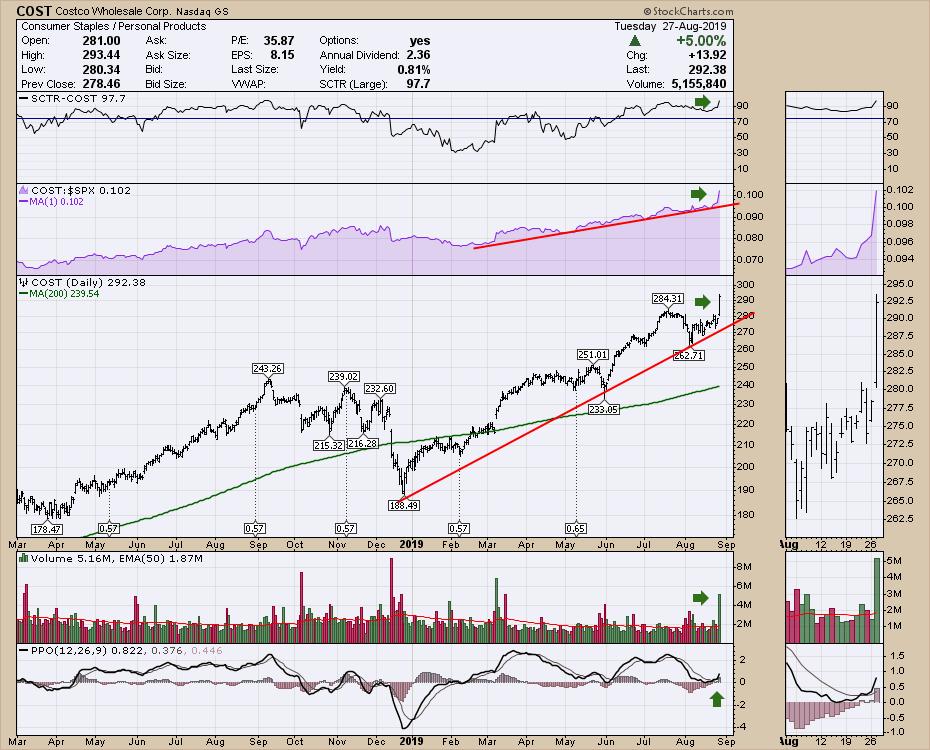
Costco (COST) continues to outpace most of the retail space with strong price action. While Tuesday was a weaker market overall, Costco, by contrast, was able to cleanly break above a small area of resistance. Costco also soared on three times the volume, which is what we like to see as the stock moves up.
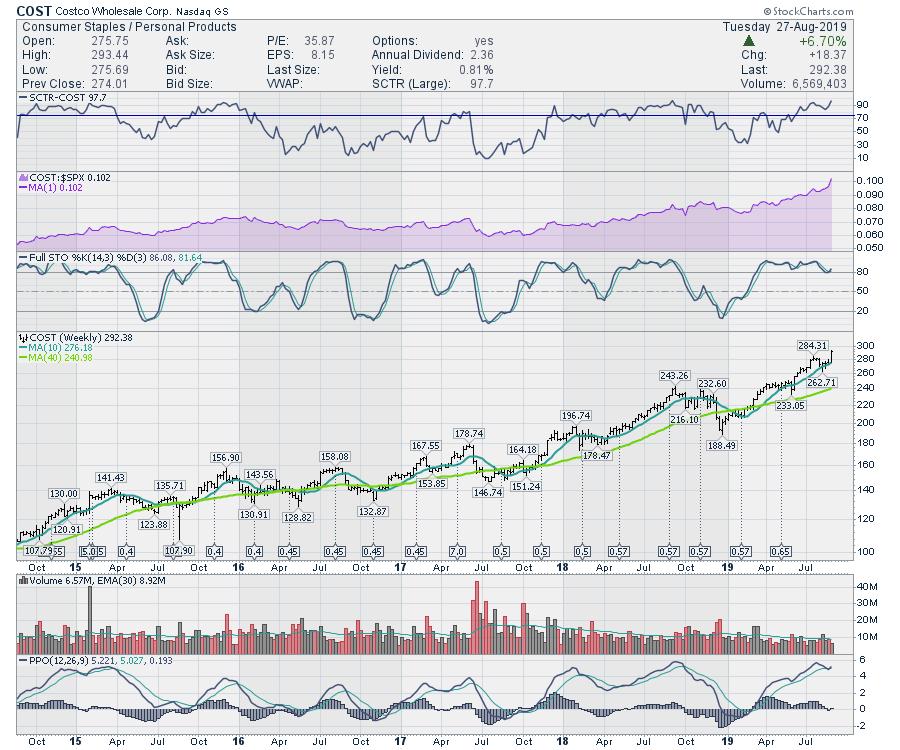
The weekly chart looks just as good. I do have trouble buying, though, with the PPO way up at the highest level in 5 years. So the real question is: "Can a person add to Costco here?". I would suggest that the prudent thing to do is wait for a little pullback and, subsequently, set your stop near the breakout level of $284.
Lately, my bullish calls as the market has been correcting haven't been working out so well. So, while I like this chart shape, I'd be cautious buying fresh breakouts here unless the indexes break out.
Good trading,
Greg Schnell, CMT, MFTA
Senior Technical Analyst, StockCharts.com
Author, Stock Charts For Dummies
Want to stay on top of the market's latest intermarket signals?
– Follow @SchnellInvestor on Twitter
– Connect with Greg on LinkedIn
– Subscribe to The Canadian Technician
– Email at info@gregschnell.com
