The PSUBank Index has a shown sharp surge in its relative momentum against the broader CNX500 index. This keeps this index firmly in the leading quadrant of the Relative Rotation Graph, where it accompanies the NIFTY Infrastructure Index. The Container Corporation of India (CONCOR.IN) from the Infrastructure index and the State Bank of India (SBIN.IN) from the PSUBank index present interesting set-ups for technical charts.
Container Corporation of India (CONCOR.IN)
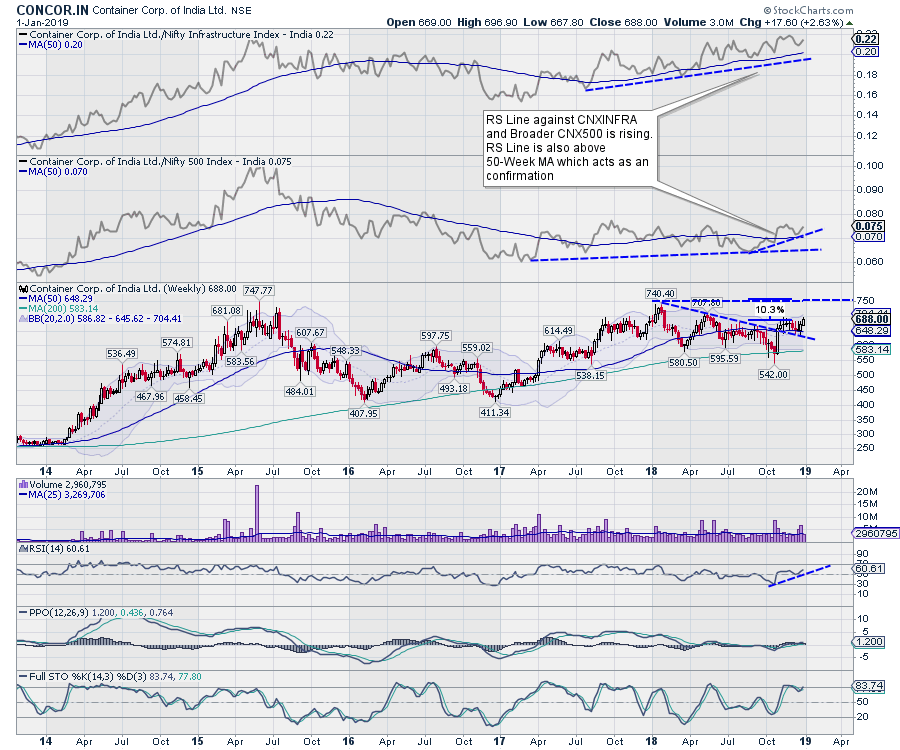
After peaking at 740 in early 2018, the stock has remained under broad consolidation, forming lower tops but relatively out-performing the broader markets. Presently, it is seen breaking out of a falling trend line, which joins the high of 740 with the subsequent lower tops on the weekly charts.
The RSI is seen marking a bullish divergence and a 14-period high. On the Daily Charts, the price has closed above the upper Bollinger band, which indicates that the present up move can continue. Daily MACD has shown a positive crossover and PPO has just turned positive on the daily charts. Weekly RSI, too, has marked a fresh 14-period high and is seen breaking out after forming a higher bottom. Weekly MACD remains in continuing buy mode. The upward revision in price over the coming days cannot be ruled out. CONCOR.IN also remains in the leading quadrant when compared against CNXINFRA on the Relative Rotation Graph.
If the present structure of the chart is resolved on expected lines, the stock may potentially return ~10% from current levels. Any move below 668 will be negative for the stock.
State Bank Of India (SBIN.IN)
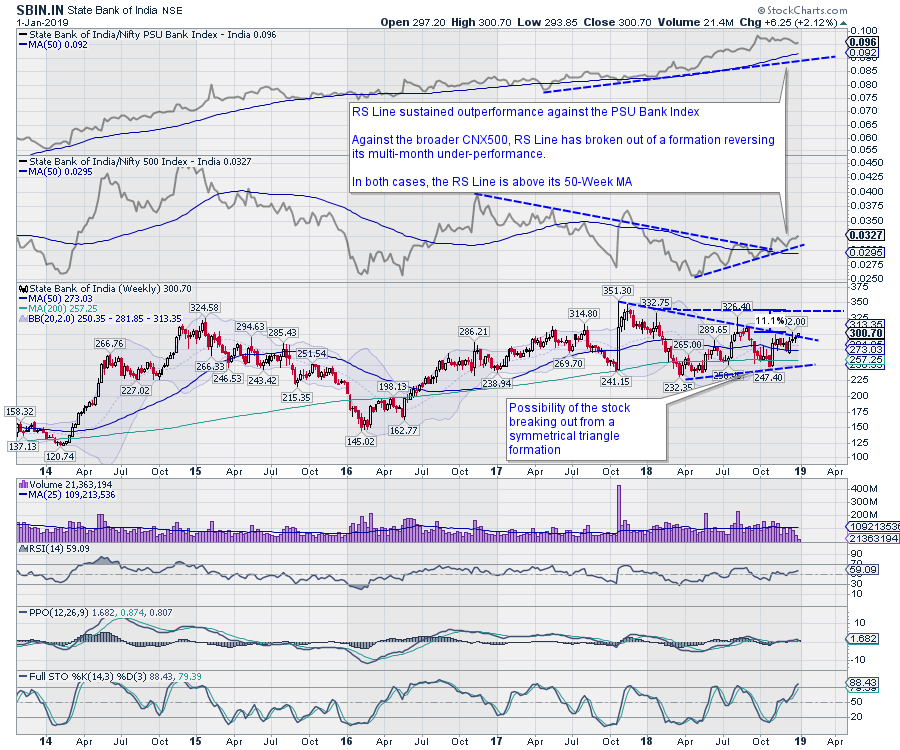
For the majority of 2018, SBIN.IN has experienced a broad consolidation. Presently, it remains in a large symmetrical triangle formation. Despite this, the stock has generally out-performed the PSU Bank Index, as indicated by the RS Line. It can be seen reversing its trend against the broader CNX500 after a multi-month under-performance.
Following sideways consolidation in a defined range, the stock looks to break out of the symmetrical triangle formation on the weekly charts. The RSI, on both daily and weekly charts, has marked a 14-period high, which is bullish. The PPO has turned positive. The stock has its largest weight in the PSU Bank Index, an index which is set to relatively outperform the broader CNX500; it remains in the leading quadrant on Relative Rotation Graph when bench-marked against the broader CNX500. Upward revision in prices over the coming days cannot be ruled out.
If this symmetrical triangle pattern is resolved on the upside, the stock can potentially return ~11% from the current levels. Any move below 274 will be negative for the stock.
Milan Vaishnav, CMT, MSTA
Consulting Technical Analyst
www.EquityResearch.asia
Disclosure pursuant to Clause 19 of SEBI (Research Analysts) Regulations 2014: Analyst, Family Members or his Associates holds no financial interest below 1% or higher than 1% and has not received any compensation from the Companies discussed.