After experiencing a brutal decline that began in September 2018, the NIFTY found support just below the 10000 mark and witnessed a technical pullback. This technical pullback halted near the 10950 level in early December 2018. Over the following two months, the index hit resistance multiple times and has remained unsuccessful in its efforts to move past this level.
As the market attempts to reach this level once again and potentially take out this immediate and important resistance area, we need to take a hard look at what it will take for the markets to secure a sustainable breakout above this point.
Whenever any market attempts a breakout, it requires strength and all-around participation (or at least above-average participation) to make it sustainable. At this point, market breadth comes into the picture. Market breadth is a technique used in technical analysis that attempts to gauge the direction of the overall market. Market breadth indicators analyze the number of companies advancing relative to those declining. Rallies that have a higher number of stocks participating are often known to sustain themselves for a longer duration.
When we speak of the overall health of the market or the sustainability of any anticipated breakout, a look at the market breadth of the market is required. The contribution to the breadth comes from the Broader Markets. A close look at the $CNX500 Index, which represents the broader market, throws up some interesting insights.
The CNX500 Index, composed of 501 stocks, represents over 95% of the free float market cap.
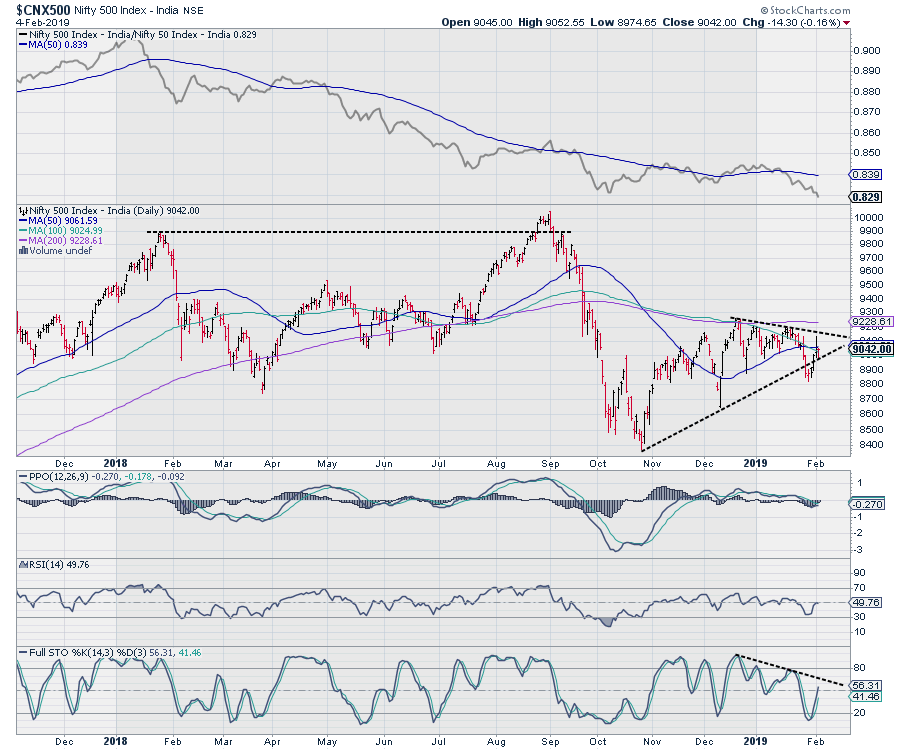
The chart shown above is the daily chart of the CNX500 index. After marking a double top near 10000 and a subsequent corrective move, the index rebounded from just below the 8400 mark. Though it made higher bottoms, the index is presently trapped in a narrow range inside a symmetrical triangle formation. A strong move would occur only after the index moves out of this range and after the 200-DMA of 9061 is taken out.
If we zoom out and take a larger view through the weekly chart of CNX500, it shows a similar story.
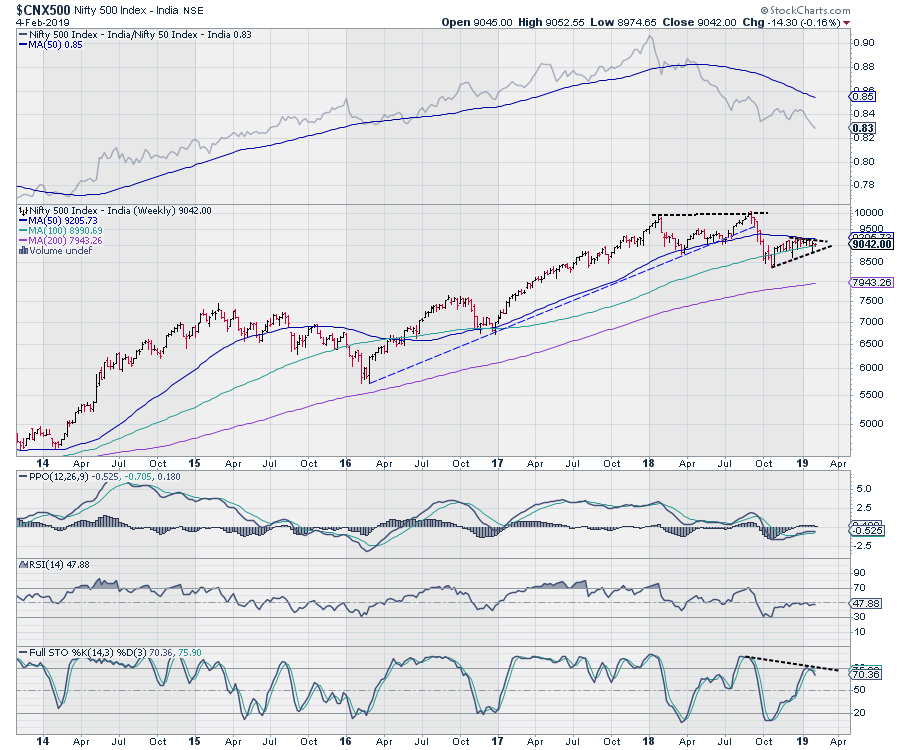
In a similar formation, the index is seen marking a double top near 10,000 level, then becomes trapped in a pattern following a corrective decline. On the weekly timeframe, the index is seen resisting to 50-Week Moving Average, which is presently at 9205. This moving average has almost become a proxy trendline for the index.
The levels of 9205 (50-Week MA) and 9228 (200-Day MA) are the levels that the CNX500 index needs to take out. Once these levels are taken out, we will see all future up moves having wider stock participation. This will lead to improved market breadth and makes up moves healthy and sustainable when they occur.
Until this happens, we will see up moves (if any should occur) coming with fractured breadth, which might make sustaining such up-moves difficult and will likely keep markets highly stock-specific.
Milan Vaishnav, CMT, MSTA
Consulting Technical Analyst
www.EquityResearch.asia