In the week that went by, the Indian equity markets did not make any directional move on any side. The index oscillated back and forth in a defined range and ultimately ended the week on a flat note. The India Volatility Index (INDIAVIX) also remained flat, losing just 0.01 points (-0.05%) during the week. In the previous weekly note, we had mentioned that the zone of 11100-11200 would act as a stiff resistance area. Indeed, the headline index was not able to move past this zone and ended with a weekly loss of 77.05 points (-0.70%).
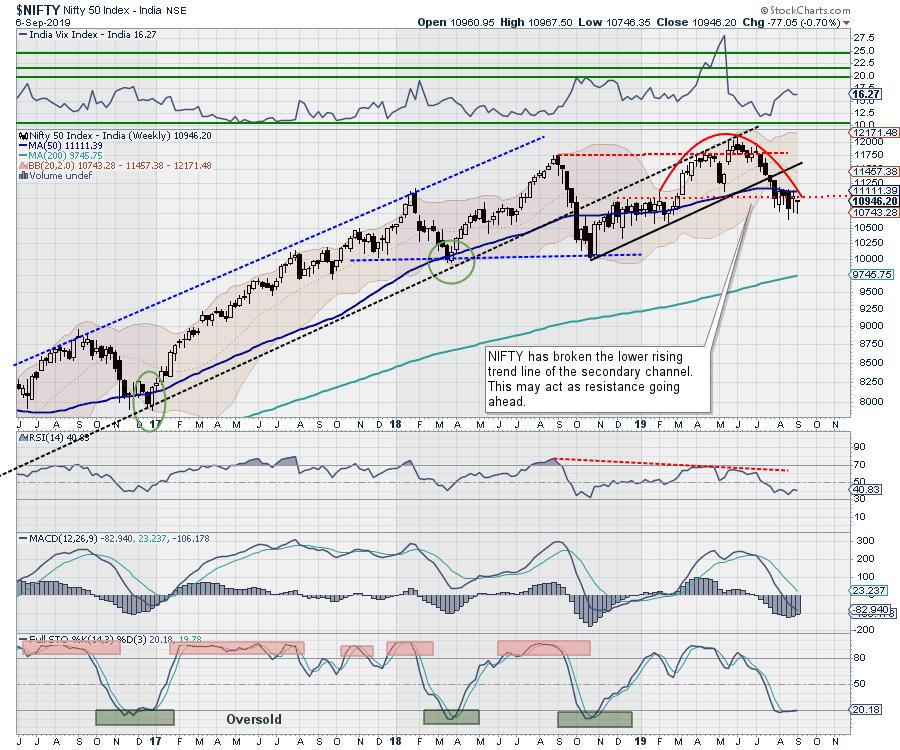
The NIFTY has managed to keep its head above the 100-Week MA, which is presently at 10901. On the other hand, the next immediate resistance point lies at the 50-Week MA, which currently stands at 11111. Speaking in weekly terms, it would be critically important for the markets to maintain levels above the 100-Week MA, a.k.a. 10901. Any slip below this crucial level will infuse more weakness in the markets.
While expecting a quiet start to the week, we expect the levels of 11100 and 11190 to act as resistance; supports are expected to come in at 10800 and 11640.
The weekly RSI is 40.83; it remains neutral and does not show any divergence against the price. The weekly MACD is still bearish and remains below its signal line.
On the Candles, a Hanging Man has occurred. Since it has emerged during a downtrend, it is called a Bullish Hammer. When it occurs during a downtrend, it indicates the formation of a support area, meaning a potential reversal of the trend. However, this will require confirmation on the next bar.
If we correlate the formation of a bullish candle with the pattern analysis, the previous week's low of 10746 will be crucial to watch over the coming days. For a bullish hammer to confirm, and for the markets to form a potential base, the previous week's low needs to be protected.
If we summarize from the above described technical setup, the two levels - 10746 on intra-week and 10900 on a closing basis - will be essential to monitor. Any violation of these levels will be detrimental to the short-term trend of the markets. On the higher side, taking out the 11100-11200 zone will be required for any sustainable directional uptrend to occur.
Given the above setup, unless any of the levels are taken out in the directions discussed, we will see the NIFTY oscillating in a broad range, just like it did during the previous week. We recommend avoiding excessive exposures on either side and vigilantly protecting profits with any move that markets offer during their range-bound oscillations.
Sector Analysis for the Coming Week
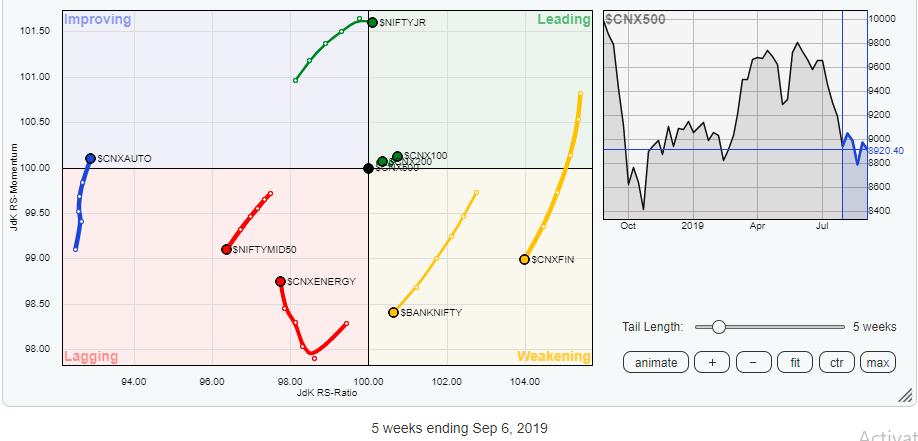
In our look at Relative Rotation Graphs, we compared various sectors against CNX500 (NIFTY 500 Index), which represents over 95% of the free float market cap of all the stocks listed.
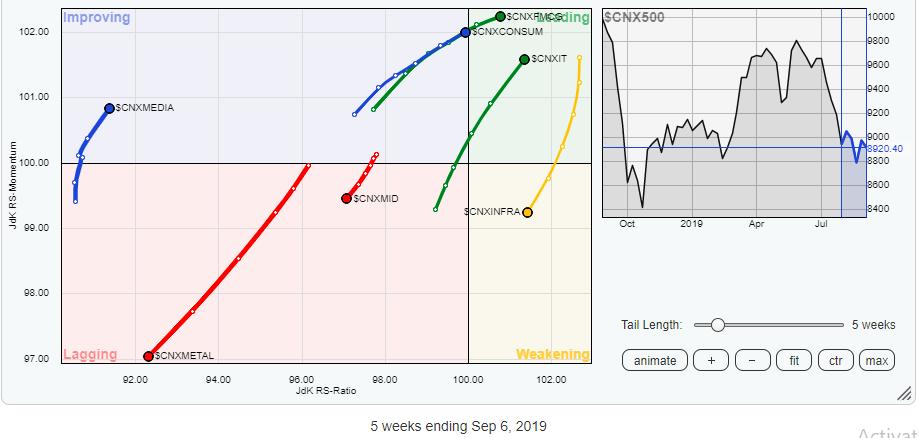
The review of Relative Rotation Graphs (RRG) depicts a picture similar to that of the previous week, albeit with some minor improvement. The FMCG and the IT index are firmly in the leading quadrant and are seen improving their relative momentum compared against the broader markets. These groups are likely to relatively out-perform over the coming week. Apart from these groups, the Consumption index has nearly reached the leading quadrant, though it remains in the improving quadrant at present.
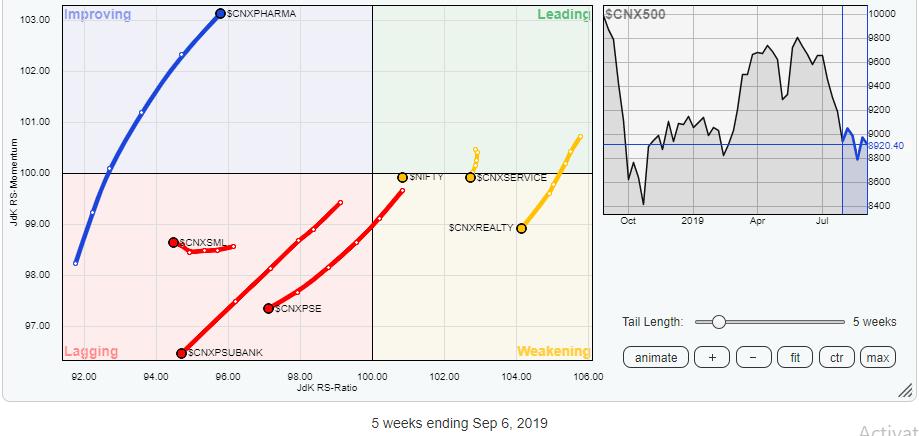
The Auto index has moved into the improving quadrant, indicating some respite from the prolonged weakness that it has been seeing. We expect some stock-specific performance from this group along with the Pharma index, which is also placed comfortably in the improving quadrant.
Besides these groups, we have the BankNIFTY, Infrastructure, Financial Services, Metal, Energy, NIFTY Mid50, PSE and CPSE indexes and the PSU banks remaining in the lagging and weakening quadrants. These groups, collectively, may underperform the broader markets on a relative basis.
Important Note: RRG™ charts show you the relative strength and momentum for a group of stocks. In the above chart, they show relative performance against NIFTY500 Index (Broader Markets) and should not be used directly as buy or sell signals.
Milan Vaishnav, CMT, MSTA
Consultant Technical Analyst,