 “You don’t have to be a genius to be successful. You just need a framework.”
—Michael Dell, Entrepreneur and Investor
For those of you who regularly download the free quarterly ChartPack updates, I don’t need to explain the value of its framework and contents. But there are still many StockCharts.com users who are unclear about how the ChartPack can improve their investing. To those folks, I’d like to suggest a simple five-step investigation. I guarantee you that, at the very least, your efforts will be rewarded with some clarity as to how you might organize and populate your own ChartLists. The five exploration steps are as follows:
1. Read the brief description of the Tensile Trading ChartPack at the Bookstore site.
http://store.stockcharts.com/collections/stockcharts-com-chartpacks/products/tensile-trading-chartpack-by-gatis-roze
2. Scroll down to view the video tutorial.
3. Scroll down again to review sample charts.
4. Read the first blog which describes the essential investment tenets upon which the ChartPack is based.
http://stockcharts.com/articles/journal/2013/11/the-tensile-trading-chartpack-users-manual-organized-optimized-for-maximizing-profits.html
5. Lastly, you may dig into the past six quarterly updates which bear witness to the ongoing improvements and enhancements.
Key Updates and Enhancements in Version 7.0:
• A ChartList of 59 Asset Allocation Options has been added. It’s a virtual buffet from which investors can choose.
• The Market Timing ChartList Permission to Sell Dashboard is now revised and expanded.
• Descriptive explanations and notes have been added to many charts.
• The Gold ChartList includes a number of revisions and new tradeable ETFs.
• The 40 Fidelity Sector Funds highlight the latest buys and sells by these funds.
ChartList 10.07: Investor Buffet of Asset Allocations-Options
Academic research has confirmed time and time again that proper asset allocation disproportionately contributes to a large portion of an investor’s profits. I am so convinced that this high-leveraged activity must be in essence the first stage of any individual’s virtuous investment cycle that I wanted to do something to make it easier for investors to assemble their own personalized assortments of asset baskets. The best way I know to do just that is to gather together a so-called ‘buffet’ of the essential 59 major asset baskets from which individual investors can choose. I loaded all of these asset baskets into a ChartList, labeled each appropriately and then pre-populated each basket with a suitable ETF. You’ll notice that I placed it first in the queue ahead of all other ChartLists, both to illustrate its importance in the hierarchy and to encourage investors to consider where they’ll invest before they start deciding what specifically to buy. Your survival depends on this! Learn about asset allocation, embrace it, and personalize it. This ChartList will make that task far easier and the end result will be better diversification.
ChartList 10.4: Permission to Sell Dashboard – 12 Indicators
This ChartList brings together twelve powerful market timing indicators. I have expanded the list to include a dozen fundamental, economic and technical indicators which will aid in your analysis and decision making when weighting the evidence at market tops and market bottoms. This quarter, I added the historically impactful Fed Funds rate as well as the leading cyclical sector ETF (XLY) to the essential dozen.
ChartList 217: GOLD
Do not overlook the notes I’ve added below many charts. For example, below the $GOLD chart in any of these three formats (1) 10 per page, (2) Chartbook or (3) Edit, you’ll see useful explanations and insights contributed by myself as well as many different investors.
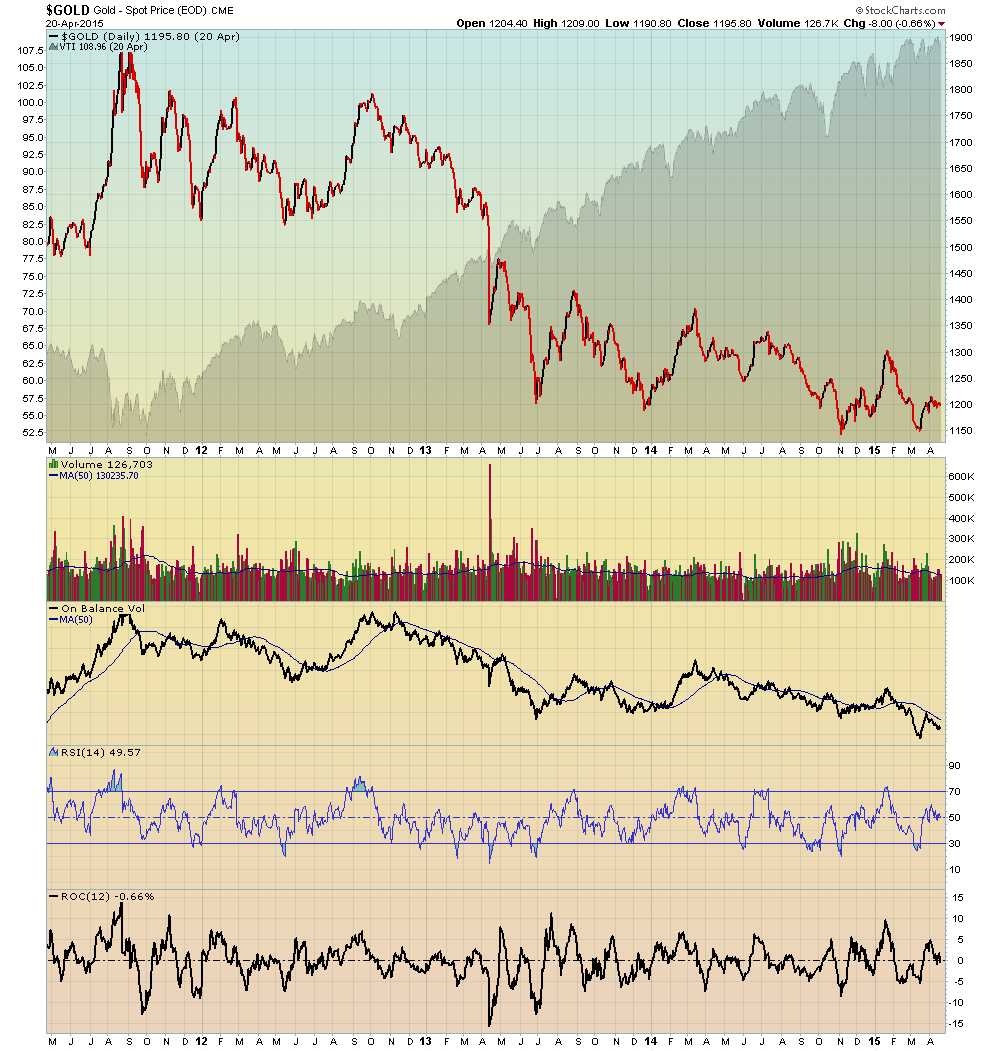
HOT...Check out the Seasonality Chart. Click on this chart, scroll down to Seasonality Chart LINK at the very bottom of the page. It will surprise most of you.
FACTOID...It is a generally accepted fact that ALL the Gold above ground amounts to approximately 171,300 tonnes which would fill ONE Olympic size swimming pool. This helps explain why investors rush to Gold as a safe haven in times of turmoil as a way to protect their Net Worth. Governments can't print more Gold!!!
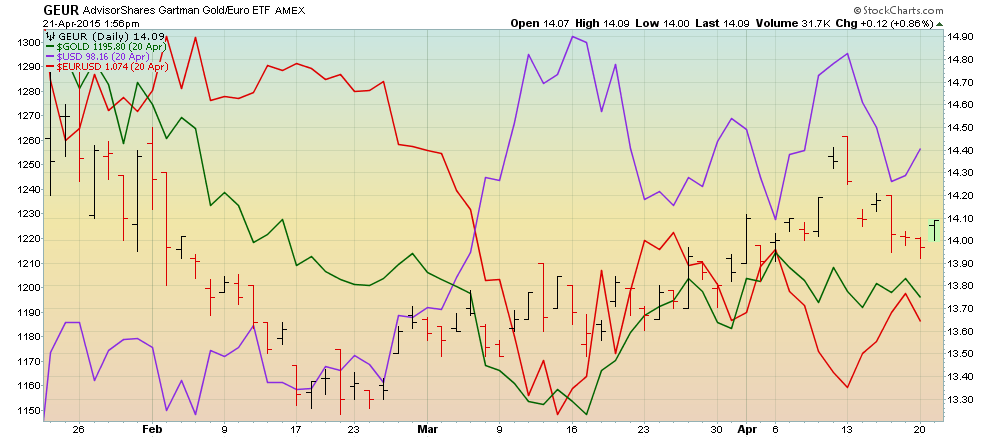
I also added a new ETF – the Gartman Gold / Euro ETF – which offers interesting diversification options.
ChartLists 420-12 through 420-88: These ChartLists have been updated to reflect Fidelity’s most recent accumulations (new buys) and recent sells (through March 31, 2015). This exercise continues to yield a significant number of tradeable insights. Each ChartList contains the individual Fidelity Sector Fund and usually the top ten individual equities that Fidelity portfolio managers accumulated for that fund. I would suggest you keep the “GR” prefix on these and don’t rename them. That way, you’ll be assured that you have Fidelity’s latest holdings reflected in your ChartList with each quarterly update.
In these updates, I’ve placed a star (*) after each new equity added to the top ten holdings over the past three months making it easily apparent what Fidelity’s new ‘buys’ actually were. One star (*) means it was accumulated in the first quarter of 2015. For the second quarter of 2015, I’ll annotate new buys with two stars (**). When you see two crosses (XX) this means that Fidelity is reducing or liquidating its position and the equity is no longer in the top ten of that fund.
I encourage you to scroll through all 40 Sector Funds which is easily done. With the annotation I explained, the specific buys and sells pop right out. You’ll notice that certain equities, such as Nabors Industries (NBR) and Smith AO Corporation (AOS), are being actively accumulated by multiple fund managers. These justify further investigation, not just into the equities, but notice the industries and sectors being accumulated. You’ll also notice that certain funds, such as Fidelity Consumer Discretionary (FSCPX) and Fidelity Environmental (FSLEX) have liquidated nearly 100% of their previous top ten positions and replaced them with new equities. Both these funds have new managers and I strongly suggest you not buy into the funds until after the first distribution date since the capital gains triggered by these sells will generate sizeable taxable events.
This past quarter, the Fidelity managers have been more active than recent past quarters. As such, it is worth reviewing these charts for tradeable ideas but also to learn how institutional managers execute buying and selling campaigns. It’s a sensational learning exercise for all investors.
Trade well; trade with discipline!
-- Gatis Roze
UPGRADE INSTRUCTIONS FOR EXISTING CHARTPACK USERS:
Important: If you have modified any of the charts in any of the ChartLists that start with “GR - ”, those changes will be deleted as part of the upgrade process. If you want to keep those changes, you need to copy those charts into a different non-"GR" ChartList before you upgrade!
To Upgrade the Tensile Trading ChartPack, follow these steps:
1. Log in to your account and then click on the "Your Account" link in the upper right corner of the web page.
2. Scroll down and find the "ChartPacks" area towards the bottom of that page.
3. Find the entry for the "Tensile Trading" ChartPack in the table that appears. (If you don't see it, that means that you didn't purchase it - click here to purchase it.)
4. Click on the "Re-Install" button next to the Tensile Trading ChartPack to start the reinstall process.
The download should take about 15 seconds. At that point, you can explore the new ChartLists and updates.
P.S. Click HERE for information on my future appearances & seminars.
P.P.S. For both convenience & consistency, please click HERE to automatically receive my blog once a week as soon as it comes out.