 Approximately every five years, I dig into my Trading Journal with the specific mandate to unearth and review where I’ve earned my profits and losses. This is not a small project. I do it on an ongoing basis with all individual trades, but when taken in the 5-year aggregate, the insights are more profound.
I breakdown my trades into four groups:
- Good Losses: Yes, I know what Vince Lombardi said. “Show me a good loser and I’ll show you a loser.” My definition of this group is a trade where I followed my disciplines but yet the market, for whatever reason, forced me to take a quick small loss. I’m a stock trader. I’m not naive or stupid. Losses are part and parcel of investing. But the operative words for losses here are quick and small. It’s fine — take the loss, now move on logistically and emotionally. By moving forward, I’m thereby one step closer to my next winning trade!
- Bad Losses: These are my dark side trades where I’ve temporarily lost equilibrium and focus, clearly failing to follow my own discipline. In other words, I reverted backwards to novice behavior. This blog is not about dealing with lost discipline. I have written other blogs about that.
- Winners: These are my bread-and-butter trades which generally produce consistent profits in the neighborhood of 20 - 50%. This series of blogs will describe, for the most part, the origins of these money makers and how they came to be.
- Tenbaggers (per Peter Lynch): I almost hesitate to address these equities for fear of encouraging a ‘home run’ investing mentality in my readership. As a trader, I’m a base hitter. I focus first on minimizing my losses and the number of losing trades. I just want to get on first base. Much like Ichiro Suzuki who won the American League’s batting crown in 2004 playing for the Seattle Mariners. Ichiro had a batting average of .372 while only hitting eight home runs. Here’s the kicker, however. Unlike baseball, the stock market occasionally offers up Tenbaggers. In essence, it’s a home run which allows the investor to run the bases not once but ten times — scoring ten runs with one hit. In the analysis of my own portfolio, my Core positions provided protection and modest growth, while my Explore positions produced both more consistent growth and index outperformance as well. A more in-depth analysis of my super Explore portfolio, however, proved that profit contributions over the years by stocks such as Amazon, Apple, MasterCard, Wells Fargo, Facebook and Microsoft were enormously impactful. I don’t go up to bat with the objective of hitting a Tenbagger. Having said that, I am open to the opportunity when it presents itself and when I’ve shown that I have the patience to let some big winners run. When they run big, their contribution to the bottom line makes you look very smart indeed.
Now that I’ve acknowledged the Tenbagger contributions, let’s focus on the stocks in Group 3 above — the base hit, bread-and-butter winners. So back to the title of this blog. Where did the idea for these winning stocks come from initially? In reviewing all my historical winners, I discovered that they originate mostly from four different arenas. Today’s blog will describe the first arena which I’ll call “Idea Source #1 — Mutual Funds.” Subsequent blogs will describe Idea Sources in arenas #2, #3 and #4.
Mutual Funds — Idea Source #1
This idea generator is somewhat unfair, although legal. The top mutual funds employ some of the best and brightest minds to be found anywhere. They spend an immense amount of time and money to sniff out and unearth the next Facebook or Amazon. The fact that, by law, mutual funds must disclose, identify and reveal their holdings every three months allows us individual investors to uncover equities under accumulation by these big institutional buyers. Their sponsorship will provide the fuel to run the prices of these equities higher. Recognizing these ticker symbols early in their moves has provided me with many profitable trades.
A number of years ago, Grayson and I began sharing this powerful idea generator by making it available to StockCharts.com subscribers. Now each quarter, investors can download the latest update of the Tensile Trading ChartPack and simply scroll through ChartLists where we’ve identified the recent stocks being purchased (accumulated) by the 40 Fidelity Sector Funds as well as those they are selling (distributing). This endows us individual investors with virtual X-ray vision, enabling us to root out and identify the hot stocks in the present market under institutional sponsorship.
For example, during the first quarter of 2017, Fidelity disclosed on April 15th that their Air Transport Sector Fund (FSAIX) brought Rockwell Collins (COL) and Spirit Aerosystem (SPR) into their top 10 largest holdings, while selling both Textron (TXT) and Jet Blue (JBLU) and removing them out of the top 10 holdings.
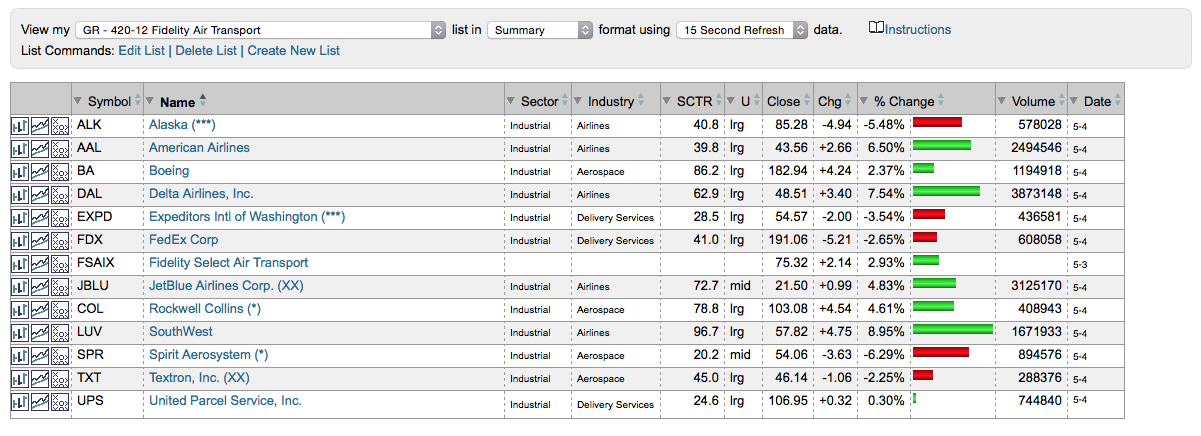
The stars next to the equities show which quarter they appeared in the top 10 holdings. For example, one star (*) means the first quarter of 2017; three stars (***) signify the third quarter of 2016. The double “X” (XX) tells us that the stock has been sold out of the top 10 this past quarter.
This arena for ‘fishing’ has produced sensational results for me over the years. Here are 10 other quick observations about this approach:
a) I get confidence in trading particular equities when I see confirmations amongst multiple mutual funds. For example, if FSCSX and FSPTX are both accumulating positions in Facebook and Alphabet, then I feel more secure in trading those two equities.
b) Look at portfolio weightings of the equities for deeper insights. For example, Fidelity Select Retailing (FSRPX) has outperformed all of its peers over 3 years, 10 years and 15 years.
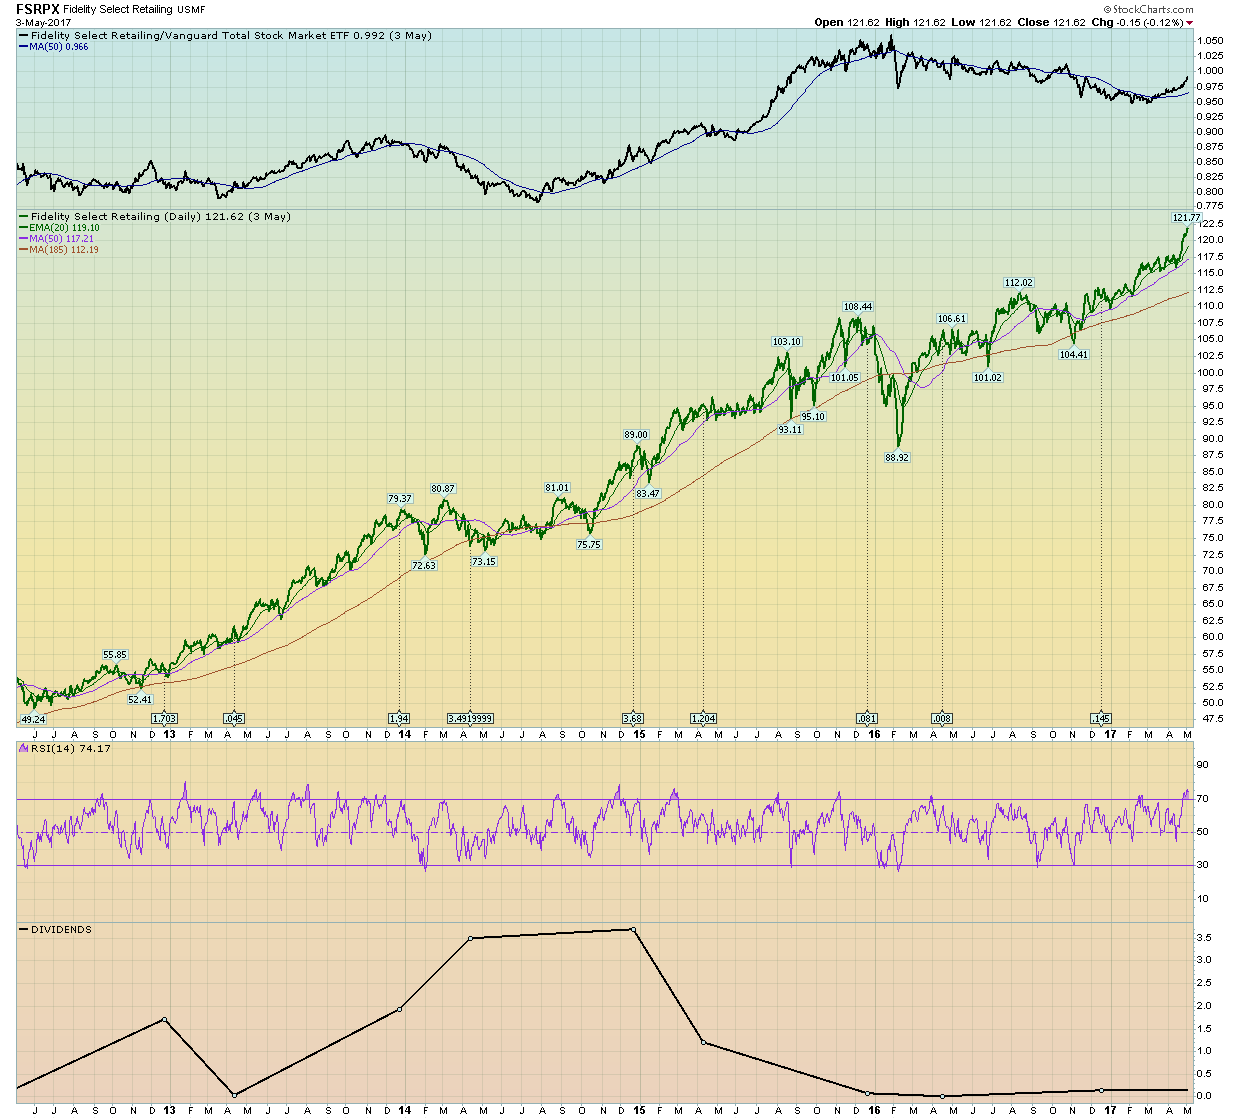 Take notice that 25% of the portfolio is in Amazon, but only 1% is in Macy’s. The fund is clearly betting on one equity over the other. Ask yourself why it has 20% in Home Depot. Could it be that Amazon is never going to get into the business of shipping bricks, flooring and lumber? These are strategic insights which will help you invest. The insights keep coming.
c) A reasonable investable idea coming out of this arena might be to buy Fidelity Select Technology Fund (FSPTX) outright. It’s a no-load fund with no deferred loads, no 12b-1 fees and a $2,500 minimum purchase. It’s outperformed 98% of its peers year-to-date. Don’t get stuck on the idea of only having to buy individual stocks.
d) From a personal investor growth standpoint, I don’t believe there is any better education forum than reviewing the specific buying campaigns and selling campaigns of the Fidelity sector fund managers from the previous quarter. As a tool for improving your ‘Wyckoff’ skill set, you can witness firsthand how institutions accumulate and distribute their positions over weeks and months. Volume analysis will be particularly helpful here.
e) As a savvy individual investor, it is important to discipline yourself to be watchful and persistent each quarter as to what the market is doing to these 40 sectors and how Fidelity is responding. This will help you to develop your intuition as well to unearth new opportunities on which you can capitalize. Remember, this arena of ideas is not based on some talking head’s theoretical pronouncements. It is based on informed institutional portfolio managers who have crunched the numbers, interviewed the management and deemed the stocks worthy of their dollars. No rumors or gossip involved here! Just straight voting with their investments.
f) Don’t fall prey to the assumption that if Fidelity is starting to accumulate a big position, you are late to the party. Yes, wait for volume-based evidence that the institutions are indeed buying before you pull the trigger, but remember that you are in a canoe up against institutional battleships when exit time arrives. When you begin to see them distributing their positions, take your money off the table. Pay attention and sit close to the exits in your canoe. When you combine the old school fundamental research and gum-shoe skills of Fidelity with the chart reading abilities of a competent technical analyst such as yourself, the result is an awesome formula for outperforming the market.
Back at you next time with Part 2 of where my best investments and trades have come from!
Trade well; trade with discipline!
- Gatis Roze, MBA, CMT
- Author, Tensile Trading: The 10 Essential Stages of Stock Market Mastery (Wiley, 2016)
- Presenter of the best-selling Tensile Trading DVD seminar
- Presenter of How to Master Your Asset Allocation Profile DVD seminar
- Developer of the StockCharts.com Tensile Trading ChartPack