 The current Relative Rotation Graph for US sectors is sending a very clear message for two sectors!
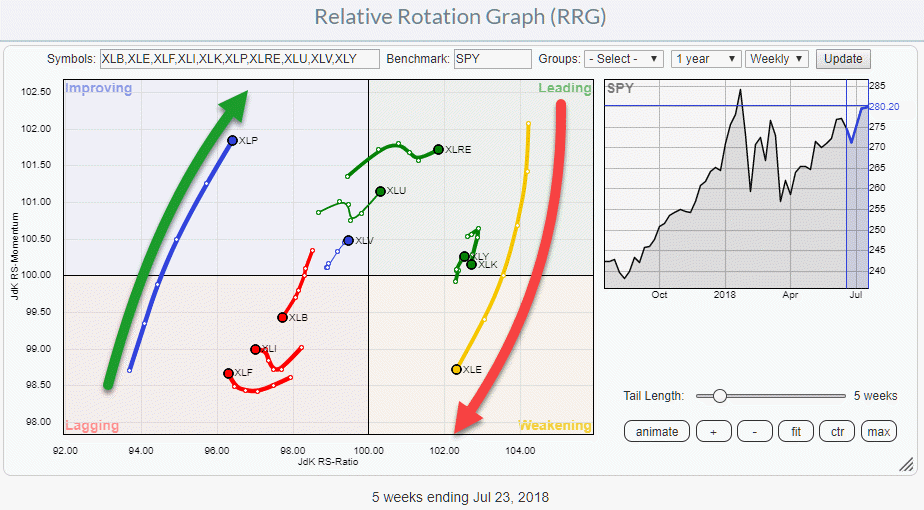
Money is flowing OUT of Energy stocks (XLE) and INTO Staples (XLP). The opposite rotation for those two sectors is almost jumping off the screen when you open up this RRG.
It is not every day that such a clear opposite rotation shows up hence it deserves my attention ;)
Both sectors are showing a very long, and powerful, tail. The Energy sector in recent weeks rotated from a strong position inside the leading quadrant into the weakening quadrant while gradually bending into a negative RRG-Heading (180-270 degrees).
The Consumer Staples sector is on an almost identical path in opposite direction. Coming from a very weak position inside the lagging quadrant it started to rotate upward and move into the improving quadrant a few weeks ago. The length of the tail and the strong RRG-Heading suggest that there is more positive rotation in store.
This rotation clearly indicates that there is money flowing from Energy stocks to Consumer Staples stocks at the moment. The length of the tails on both sectors and the direction in which they are heading suggests that this process will continue a bit longer.
Energy - XLE
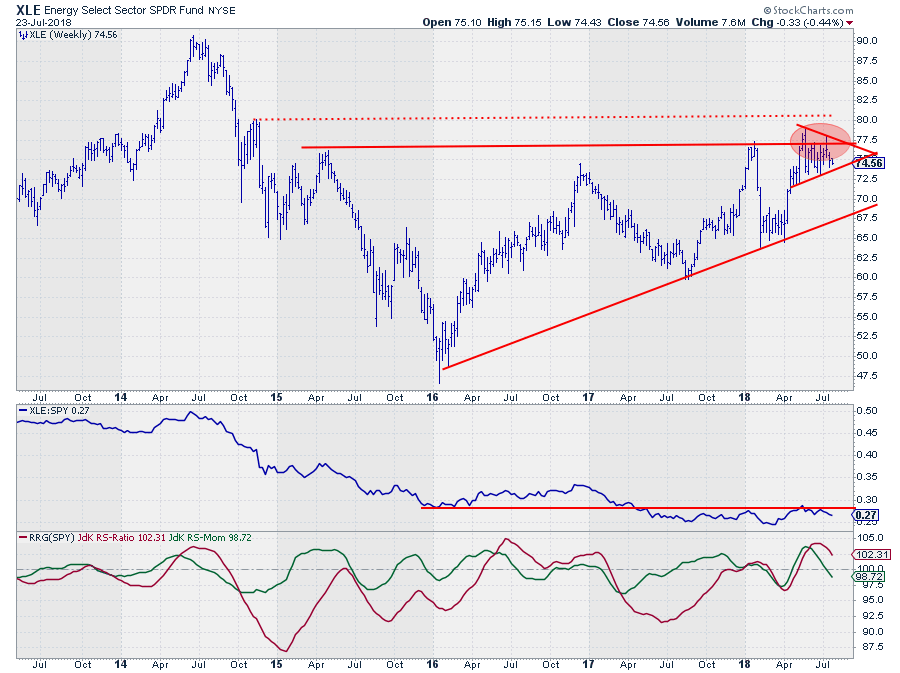 From April onward things looked pretty good for the energy sector. Price just found support and put in a new, higher, low against the rising trendline and started to rally towards resistance around $ 77.50. The RRG-Lines moved higher in tandem, positioning the sector well inside the leading quadrant.
The raw RS-Line moved higher but eventually could not make it past overhead resistance. At the same time price ran into trouble at the resistance area and started moving sideways in, what now seems to be taking the shape of, a triangle formation.
There is still a possibility that this triangle will appear to be a continuation pattern but we would need an upward break in the coming weeks. Based on the resistance at the top of the triangle and the weakness that is starting to show up in relative strength I expect the eventual break to occur on the downside and push the price down again. At least towards the level of the rising support line again.
Very likely this will cause the relative strength of XLE vs SPY to weaken further and eventually cause a rotation into the weakening quadrant on the Relative Rotation Graph.
Consumer Staples - XLP
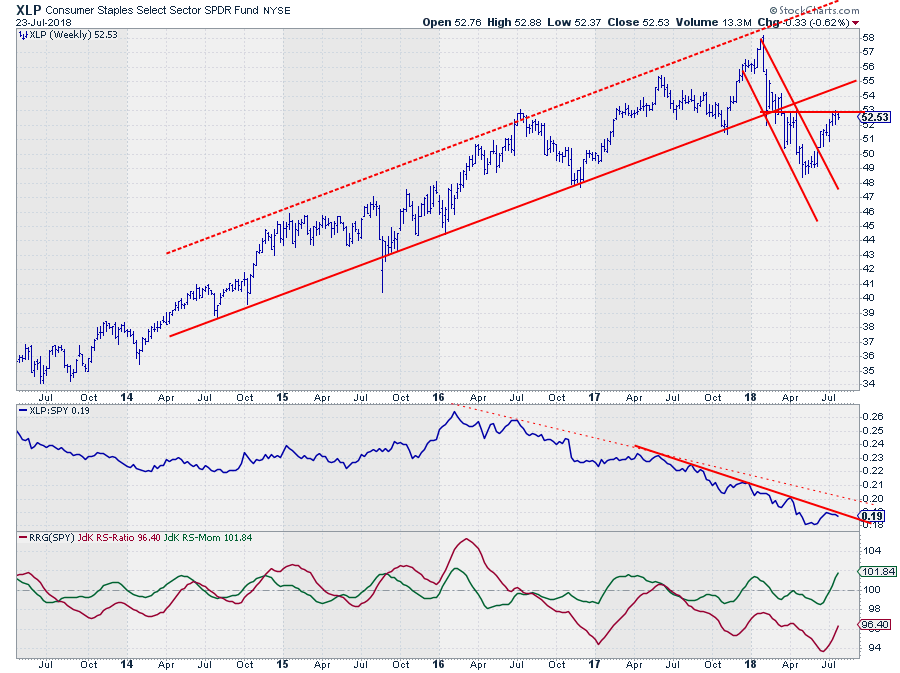 The relative strength of Staples against the S&P 500 is showing a clear downtrend since the start of 2016. Based on the still downward trending channel in the raw RS-line, it is not the best sector around.
However, the recent rise of relative strength, albeit still well below the falling resistance line(s) and below its own most recent high and low, caused the RRG-Lines to rise sharply in a short period of time. This indicates that "something is cooking".
Shifting attention to the price chart learns that Staples has dropped out of a long-term rising channel at the beginning of this year in order to continue lower and set a new low around $ 48. The rally out of that low is now challenging overhead resistance near $ 53. And even if this level gives way new overhead resistance may be expected at the level of the former rising support line, currently around $ 55.
Hence, upward potential, in price terms seems limited for now. Knowing that Staples is generally seen as a "defensive" sector the apparent improvement in relative strength makes me raise my eyebrows... Especially in conjunction with the negative rotation for Energy.
Just like relative strength for Staples moved lower from early 2016 onward, while price continued to rise, but lagged the rally in the S&P 500, it is very well possible for the price of Staples to move lower but lag a decline in SPY and show a rising relative strength.
We are not at that junction yet but this rotation, for me, is definitely a warning signal. Maybe it's early, maybe it's too early but it would be unresponsible not to address it and at least keep track.
Against each other
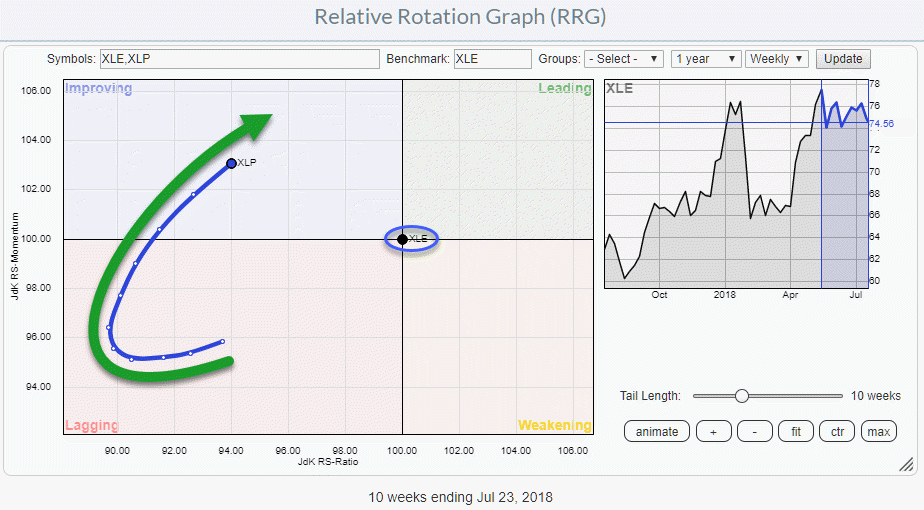 The above RRG shows XLP rotation against XLE as the benchmark. The rotation is more or less similar as against SPY but bending over towards leading a bit more aggressively.
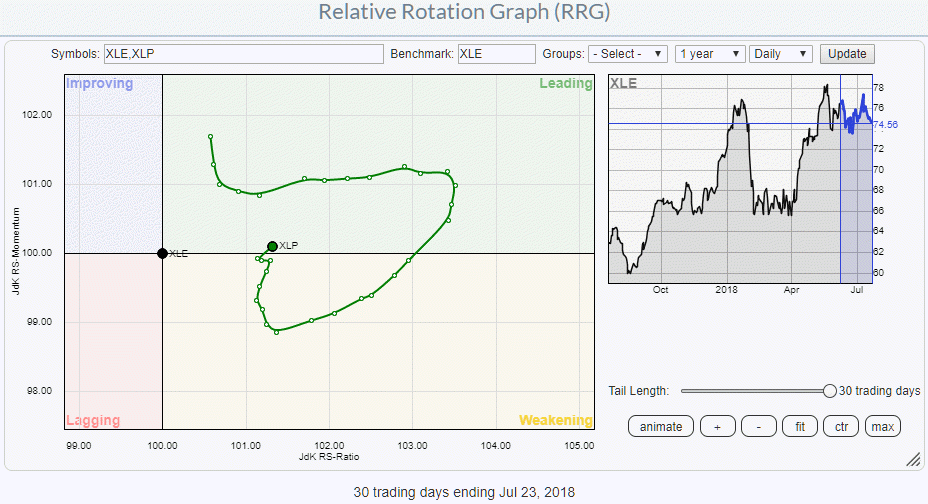 The daily version of this RRG shows how the rotation of XLP against XLE took the sector through leading, then down into weakening and now back into leading again without returning to the left-hand side of the RRG.
So the short term is pointing for a preference of Staples over Energy with the tail pushing into the leading quadrant while the longer term picture is picking up traction with the tail lengthening and heading towards the leading quadrant while inside improving.
Positioning things on the Sector Rotation Model
At times I find it a good exercise to try to match the positions, that I observer on the RRG, for the various sectors with the theoretical positions on the Sector Rotation Model to get a handle on the potential position for the general market.
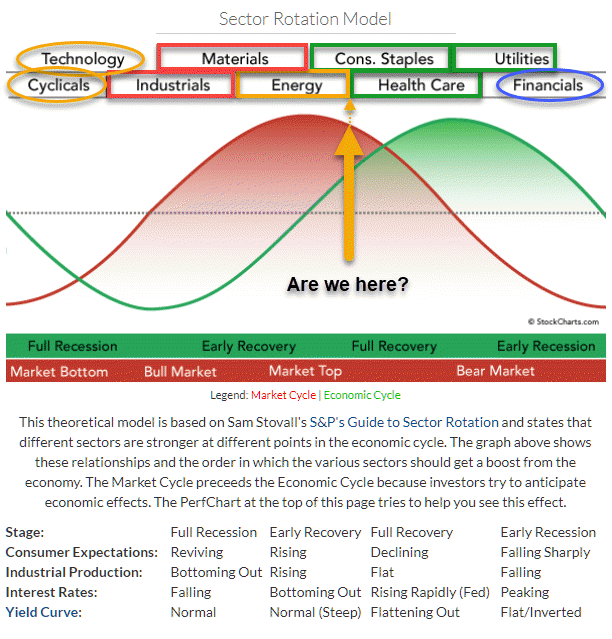 On the model-picture, I have indicated the current positions (out- or under-performance trends) of the various sectors. Clearest is the current rotation out of Energy into Staples which is a rotation that usually takes place during a toppish market environment. The other sectors with clear positions and rotations on the RRG at the moment are Industrials and Materials which rotate negatively and are expected to underperform going forward which matches the assumption.
Also to the right of the Energy-Staples rotation we find Health-Care and Utilities that both started to improve in recent weeks.
The "unknowns" at the moment are Technology and Cyclicals (Consumer Discretionary) to the left and Financials to the right.
All in all, there seems no reason t panic as when I am writing this the European markets are up around 1% while they seem to be breaking out of a two-month downtrend. And the S&P is still holding up above that 2800 level and is looking to have a good start of the day today (7/24-2018).
Nevertheless, I wanted to put this observation in front of you as something to keep in the back of your head.
The mind is like a parachute: "It only works when it is open".
Let me know what you think of this usage of RRG in the comments below. If you would like to receive a notification when a new RRG blog article is published, simply "Subscribe" with your email address using the form below.
Julius de Kempenaer | RRG Research
RRG, Relative Rotation Graphs, JdK RS-Ratio, and JdK RS-Momentum are registered TradeMarks ®; of RRG Research
Follow RRG Research on social media:
If you want to discuss RRG with me on SCAN, please use my handle Julius_RRG so that I will get a notification.
