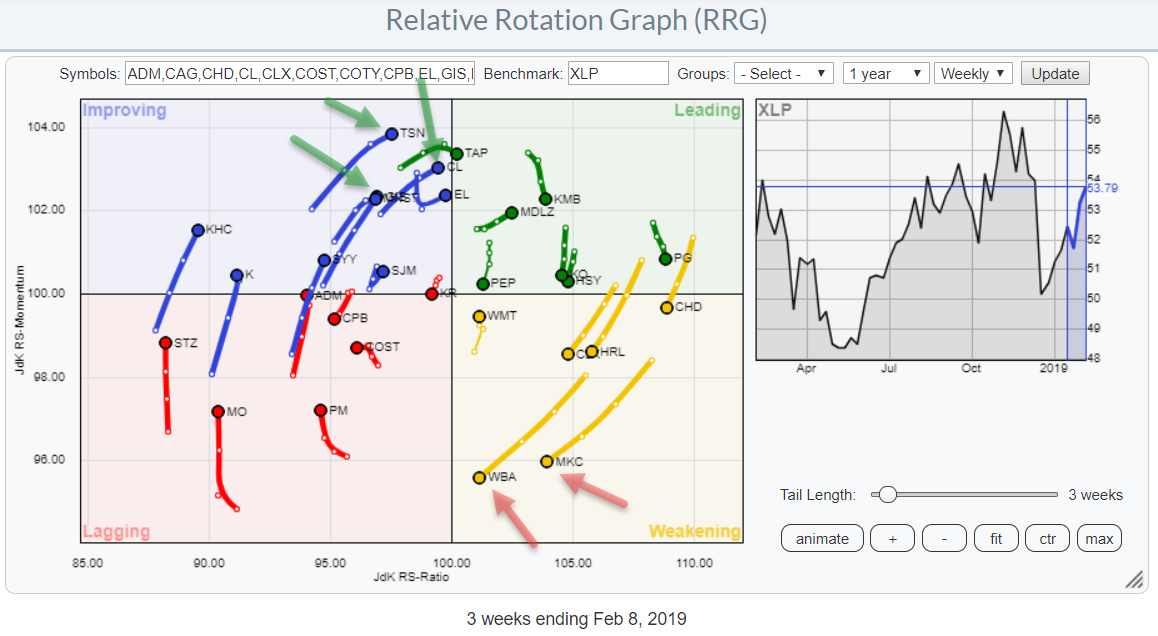
 The Relative Rotation Graph shows the rotation of the stocks in the Consumer Staples sector against XLP, the Consumer Staples sector index.
Keen observers may notice that I have left out COTY and CAG because they are very disconnected and distorting the picture. If you click on the image and open up the live version of this chart they will be there!
In this article, I want to take a look at the internals of the Staples sector as XLP has started to rotate towards the leading quadrant on the daily RRG for US sectors while inside the weakening quadrant on the weekly RRG.
If and when the strong rotation on the daily chart is the prelude for a rotation back towards leading on the weekly chart as well then we can use the Relative Rotation Graph for individual stocks (with XLP as the benchmark) to see which stocks could be leading or lagging this rotation.
Summary
- Consumer Staples sector improving again on daily RRG
- WBA and MKC are inside weakening but rotating towards lagging
- TSN, GIS, and CL are inside improving and rotating towards leading
- CL completes bottom formation to support improvement in relative strength
From A Sector Perspective
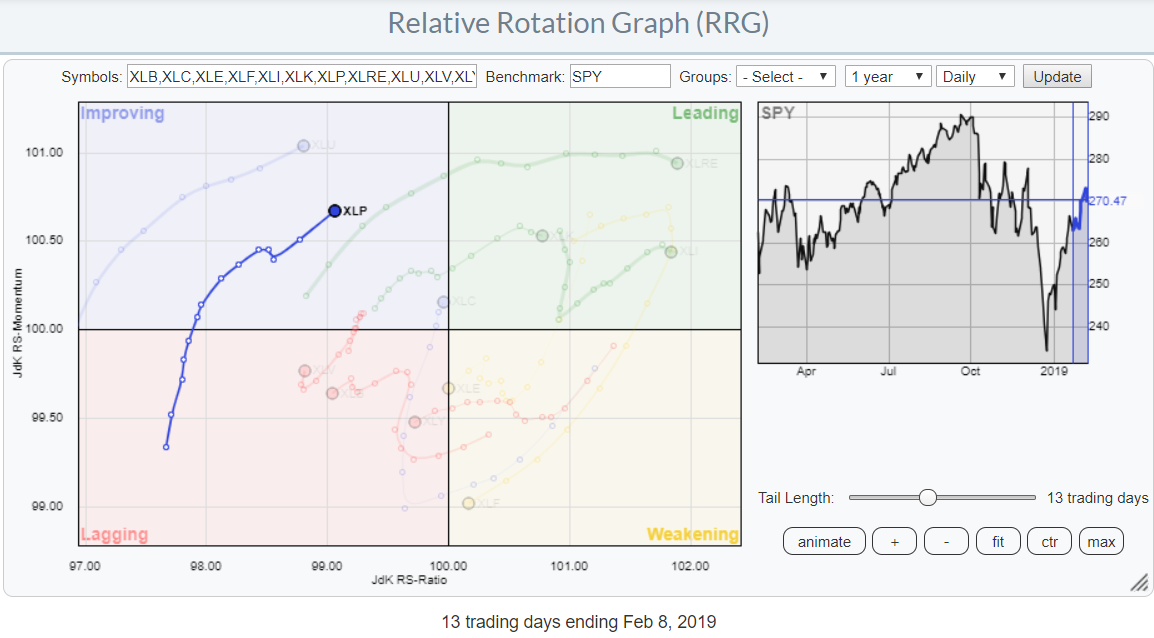 Since my previous article on the improvement for more defensive sectors on daily RRGs, XLP continued to rotate further into the improving quadrant and towards leading.
After a small dip in the middle of last week, XLP has picked up the positive RRG-Heading again and started to move further towards the leading quadrant.
With the tail of XLP inside the weakening quadrant on the weekly RRG, this is providing us with an interesting and potentially promising situation. We know that very strong relative trends tend to rotate on the right-hand side of the RRG; leading-weakening-leading.
Consumer Staples - XLP
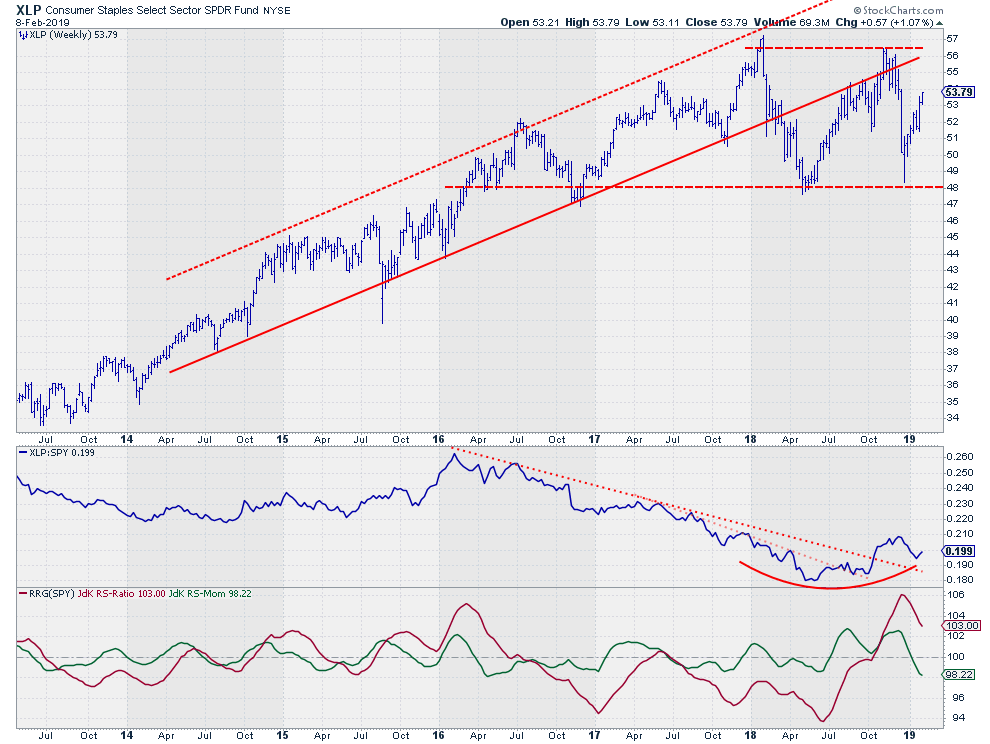 The relative strength of staples against SPY has turned around in Q4-2018 after a downtrend that started at the beginning of 2016. Initially, this break out of the bottoming formation led to a new high in the RS-line at the end of the year. The dip that we have experienced since then looks to be the first meaningful corrective move after the breakout.
This correction has held up above the level of the previous high, now support, as well as above the level of the former falling resistance. And the first signs of a new, higher, low are being put into place.
all in all, it looks as if the turnaround in relative strength has been confirmed and that a new move higher can be underway anytime soon.
The RRG-Lines are taking a breather as a result of this correction in RS but JdK RS-ratio is still well above the 100-level and has enough room to put in a low above 100 when the improvement that we are seeing on the daily charts will be able to continue.
Also on the price chart, there is plenty of upside potential available before hitting overhead resistance which shows up between $56-57.
Building on this premise I want to take a look at the rotation of some individual stocks in the Consumer Staples sector.
Zooming In
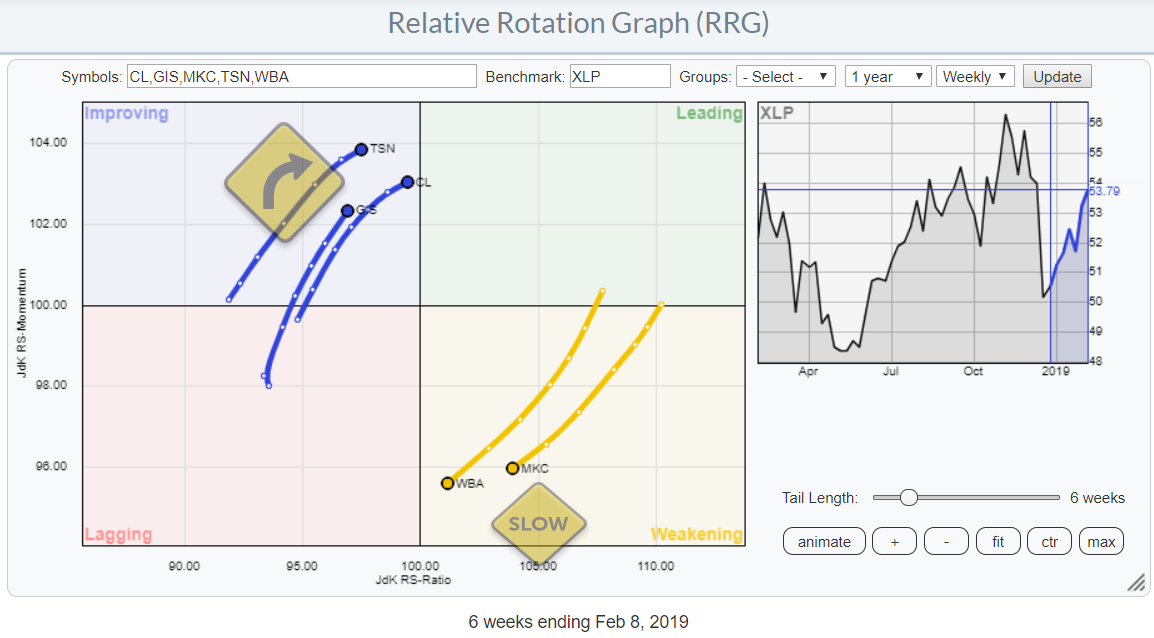 This RRG zooms in on the rotation of the five stocks that are highlighted with the arrows in the chart at the top of the article.
As I believe that it is very important to know where NOT to invest I always also highlight sectors or stocks that are expected to underperform. In the chart above the two stocks that deserve attention for that reason are WBA and MKC. They are inside the weakening quadrant and rapidly heading towards lagging. Despite the fact that XLP is a strong and improving sector it is probably better to avoid these two.
Inside the improving quadrant, I have highlighted TSN, CL, and GIS. All three have decent length tails, indicating that there is momentum behind their moves and they are moving at a positive RRG-Heading. This makes them worth a closer look.
Walgreens Boots Alliance - WBA
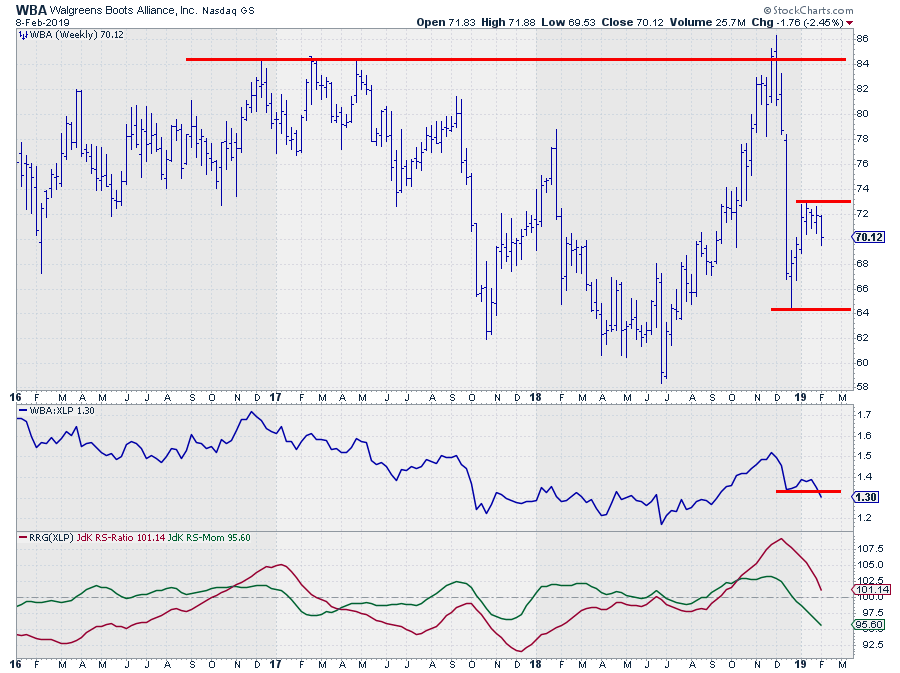
On the RRG, WBA is the one closest to crossing over into the lagging quadrant. We can see the deterioration in the raw RS-Lines where the previous low was just broken downward, essentially starting a new sseries of lower highs and lower lows.
The Jdk RS-Momentum line is already moving below 100 since the end of last year and the RS-Ratio line is now following rapidly. Not much, relative, weakness is needed anymore to push WBA into the lagging quadrant.
On the price chart, WBA failed to break, and hold, at the overhead resistance level near $84 and rapidly came down to lower levels after that failed attempt. The recovery off the low at $64 now seems to be coming to an end at $73 where a new high is put into place.
$64 is the support level to watch. A break lower will very likely cause, even more, relative, weakness.
McCormick & Co, Inc. - MKC
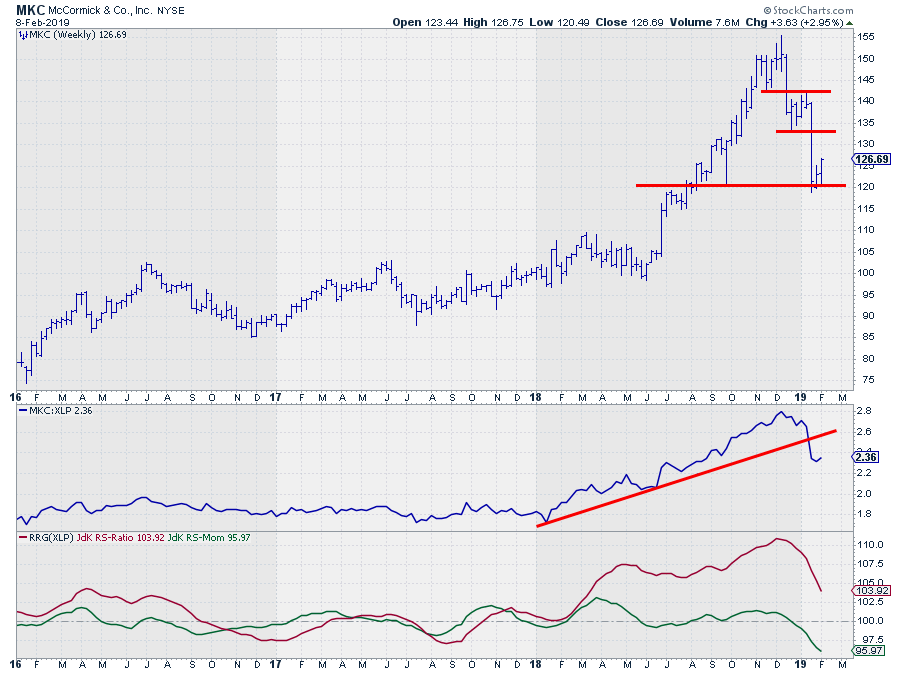
After a nice run, that started accelerating in June 2018, MKC peaked at $155 before starting a new series of lower highs and lower lows.
A new low has just formed near $120 and a small rally seems to be emerging out of that low but the previous low (~132.50) will very likely stop this move, if not earlier. Breaking support at $120 will add more fuel to the decline.
The resulting relative strength against XLP has taken a beating and broke the rising support line that started at the start of 2018. Any relative rally is expected to stall short of that former rising support line that will now act as resistance.
RS-Momentum is steeply diving further, while already below 100 and this is dragging RS-Ratio down fast as well which will very likely cause the tail on the RRG to rotate further towards and into the lagging quadrant.
The Laggards
So even with the sector, XLP, doing relatively well on the daily time frame and expected to do well again on the weekly time-frame as well soon, WBA and MKC are probably better avoided as they seem to continue to lag the performance of XLP in coming weeks/months.
Tyson Foods Inc. - TSN
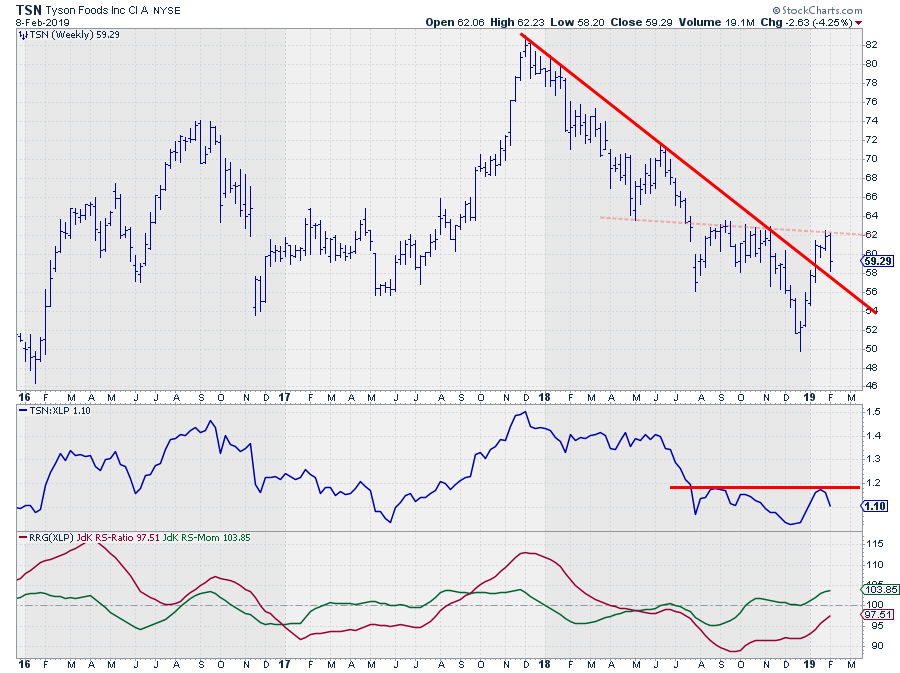
At the opposite of the spectrum of Consumer Staples stocks, we find TSN. This stock dropped from a high at $82, late 2017, to a recent low at $50 at the end of 2018. And, not surprisingly, relative strength did not do much better.
At the moment things are starting to change, or so it seems. The break above the falling resistance line means the end of the downtrend as we have seen it for the past 12 months. This former resistance line should no act as support and catch declines while a slightly down sloping resistance line is building up, now around $62.
Breaking that $62 level will confirm that the trend in price has turned around.
The RRG-Lines provide a positive picture with RS-Momentum above 100 and RS-Ratio closing in. However, out of the three, picked, stocks in the improving quadrant, this one is the least favorite IMHO because the raw RS-Line still needs to cross over that horizontal resistance to really push higher and drag the RRG-Lines solidly above 100 and the tail into the leading quadrant.
General Mills - GIS
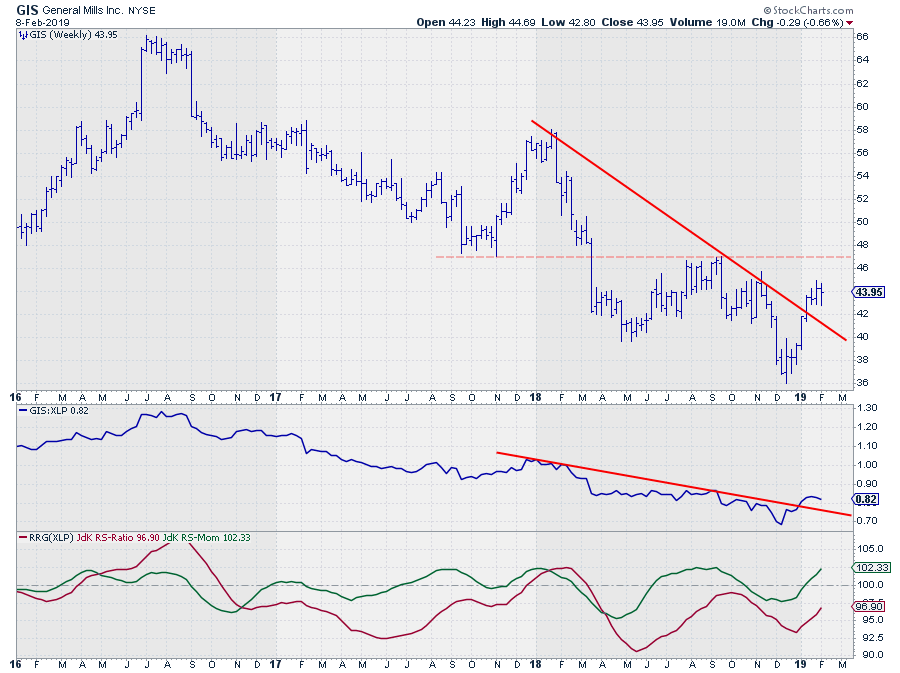
GIS recently broke above falling resistance on both the price- and the relative-chart putting it in good shape for further improvement.
In terms of price, there is a horizontal hurdle to take near $47, which is still almost 7% away from current levels. Once that happens the next resistance level is only found at $58, hence plenty of upside available both below and above resistance.
The break above resistance in relative strength is in its early stages as we still need a higher low and preferably also a higher high but things are looking better than they have done over the past year for GIS. This translates in both RRG-Lines rising with RS-Momentum already above 100 and RS-Ratio on its way.
Looking at the tail on the RRG, GIS, out of these three, needs to travel the longest distance before crossing over to leading but also has the strongest RRG-Heading (steeper that TSN and CL) giving it the advantage of good relative momentum.
Colgate-Palmolive - CL
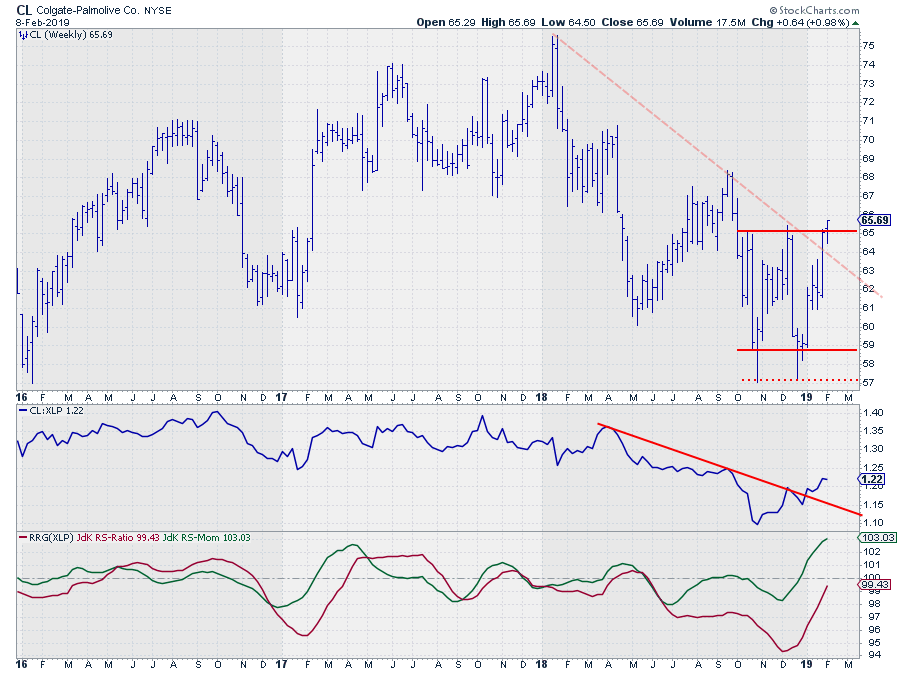
Save the best for last.
Colgate Palmolive is still inside the improving quadrant on the RRG but close(est) to crossing over.
The relative strength line seems to have turned around after declining for roughly nine months. Out of the low in November last year, relative strength gradually started to improve in a series of higher highs and higher lows, while breaking falling resistance along the way.
But the best part comes from the price chart where, after a year of declining prices, a large double bottom has been completed which will very likely help prices to move higher.
There is an overhead resistance level at the level of a previous high near $68 but based on the height of the double bottom formation a price target for this move can be pegged at $71 (measuring conventionally and not from the extreme lows near $57) where another previous high is residing.
The combination of strong and improving relative strength and the completion of a bottoming formation on the price chart makes CL one of the better stocks inside the Staples sector at the moment.
Let me know what you think of this usage of RRG in the comments below. If you would like to receive a notification when a new RRG blog article is published, simply "Subscribe" with your email address using the form below.
Julius de Kempenaer | RRG Research
RRG, Relative Rotation Graphs, JdK RS-Ratio, and JdK RS-Momentum are registered TradeMarks ®; of RRG Research
Follow RRG Research on social media:
If you want to discuss RRG with me on SCAN, please use my handle Julius_RRG so that I will get a notification.
