One of the most frequently asked questions I receive, with regard to Relative Rotation Graphs on StockCharts.com, is if and how the scan engine can be used to scan for certain events on an RRG.
Well, the answer is you can NOT - not yet, anyway. It's on the list and I'm sure it will be made available at some point, but, until then, we have to use the other tools that are at our disposal on the site.
In my last DITC blog, I used scanning in combination with RRG to find a stock that is potentially bottoming out and ready for a potential (relative) turnaround. In this article, I'll show you how I used the scan engine and RRG together to find this stock.
When I am looking for trade ideas, I want to find stocks that are "low" or beaten down, but that have since started, or are starting, to consolidate or turn around. Afterwards, the next step is to find stocks that are showing emerging relative strength in this collection.
Finding Stocks That are "Low"
For my first requirement, I am going to use the Scan Engine, where I will use the RSI to find "low" or beaten-down stocks. The universe that I am going to scan is the S&P 500 stocks.
[group is SP500]
As I am looking for trading ideas, we need liquidity, and thus I want the average volume over the last 20 days to be over 400,000.
and [SMA(20,volume) > 400000]
For the RSI, I usually use a 9-day look-back period. I prefer this over the default 14, as it is just a bit faster and reaches more extreme values more easily.
The first requirement is that I want RSI(9) to be below 40, as this ensures that there is plenty of upside for the stock before it becomes "overbought."
and [RSI(9) < 40]
The second requirement is that want the RSI to be rising. My definition of rising for this purpose is pretty simple and the nine-day period is fairly arbitrary. IMHO, it should be more than three days and probably less than say 12, but ultimately the exact number of days is not super-important.
If the scan results in too many or too few stocks that fulfill the criteria, I usually play with it a little bit until I get a group of 10-30 names.
and [RSI(9) > 9 days ago RSI(9)]
Running the Scan
The DITC blog mentioned above was published on 5 September. (As I write in the European time-zone, the last close was Wednesday, 4 September.)
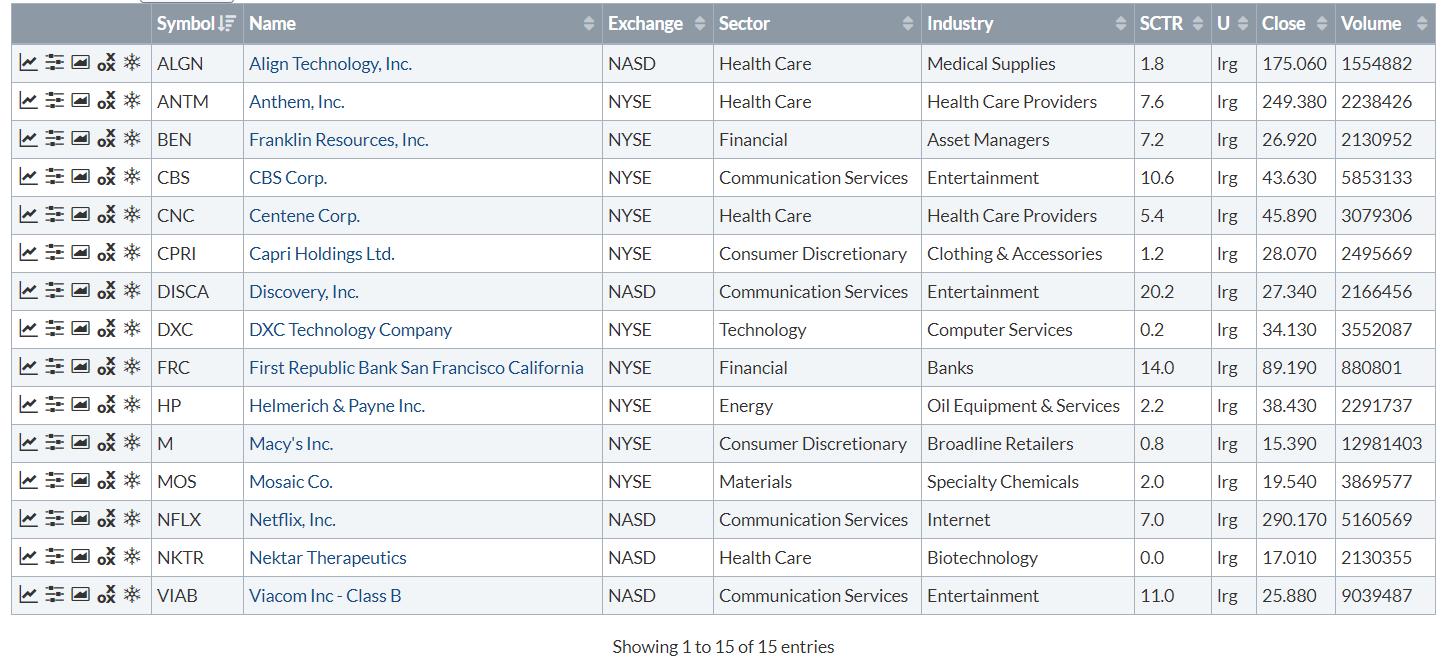
The results of the complete scan on the morning of 5 September gave me these stocks:
[group is SP500]
and [SMA(20,volume) > 400000]
and [RSI(9) < 40]
and [RSI(9) > 9 days ago RSI(9)]
Plot on a Relative Rotation Graph
The next step is to bring relative strength into the picture. For me, that means using RRGs.
From the scan results, it is very easy to save the resulting tickers to a new or existing ChartList.
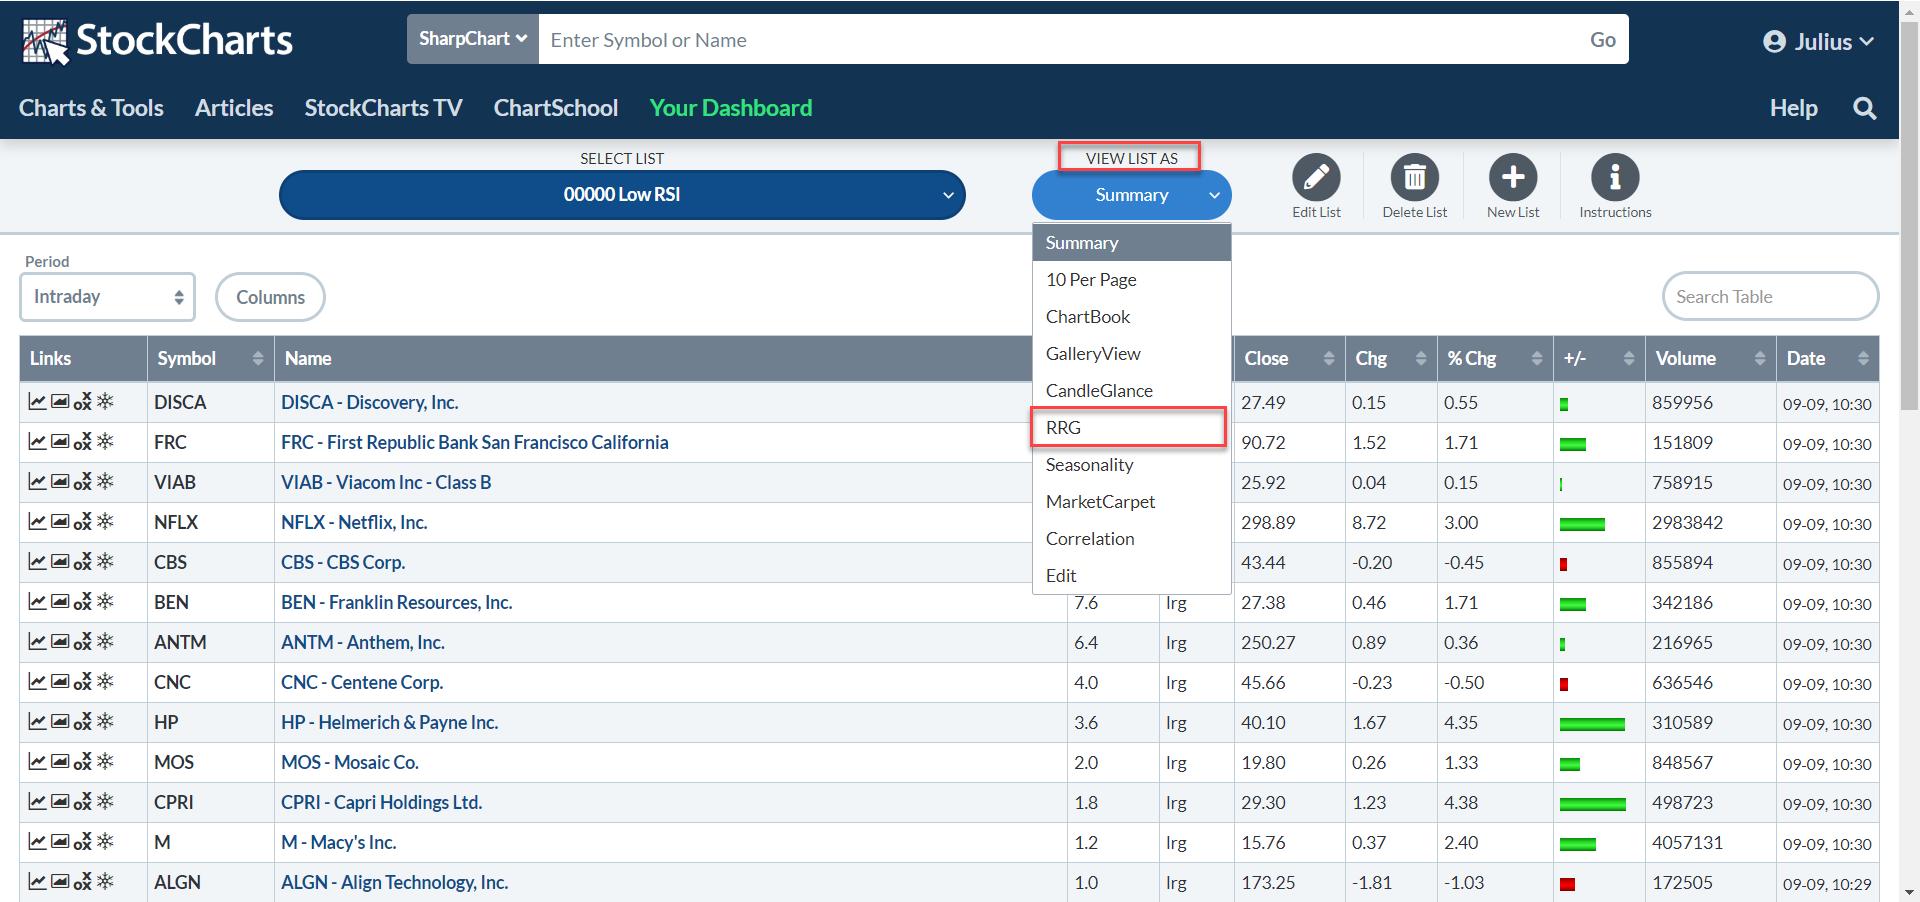
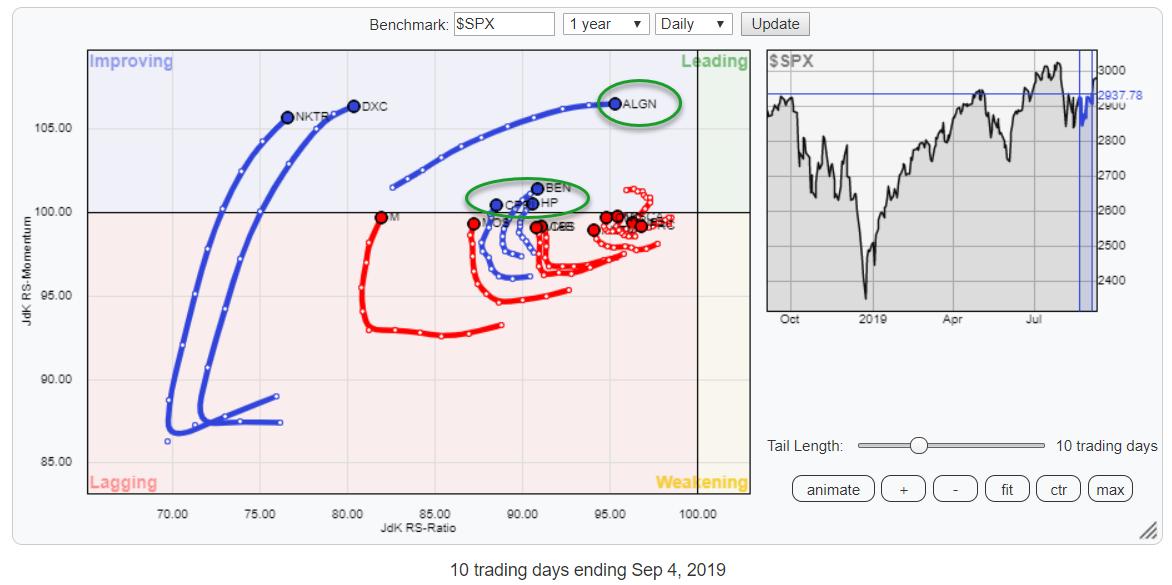
From that list, you can select "View As", followed by "RRG". This will load the tickers on the list onto an RRG, as printed below. Because the scan is done on daily data, I have changed the periodicity of the RRG to daily as well.
Note the fact that you cannot edit the symbols on the list. The reason for this is that this RRG is linked to a ChartList. When the ChartList changes, the symbols on this RRG automatically change as well.
Looking for Relative Strength in Beaten-Down Stocks
As the list holds stocks that are at "low" RSI values but on the rise, we can use the RRG image to look for stocks that are showing emerging relative strength at the same time.
ALGN is the stock that probably stands out most on this RRG, as it is traveling rapidly towards the leading quadrant. Hence why it was my choice for the DITC article last week.
With hindsight, this was probably not the best choice as since then the price dropped around three dollars, about 1.5%. Nothing major, but it is much nicer when an idea starts accelerating right away... ;) Alas. However, we're still inside the range and the bottoming process is still ongoing, so I am going to keep an eye on this one.
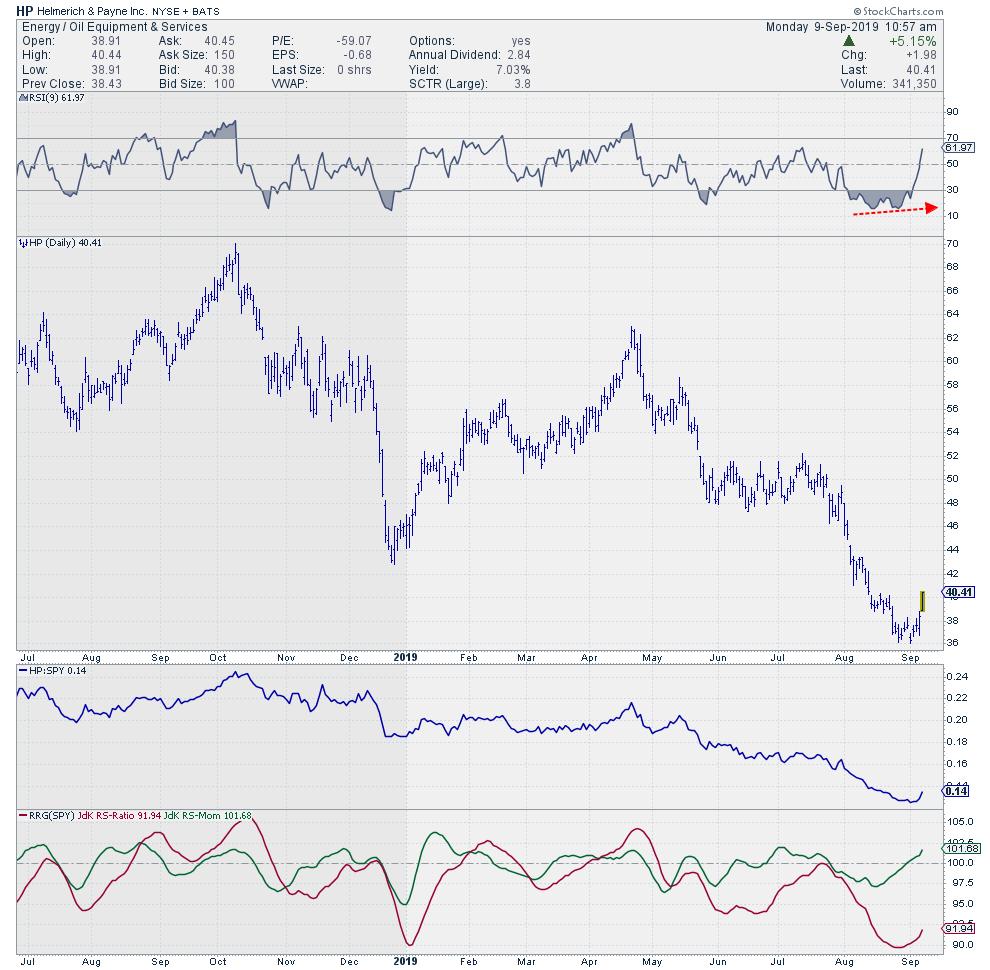
As a matter of fact, all three stocks in the second green oval, which had just crossed over into the improving quadrant and started moving at a positive RRG-Heading, have done better.
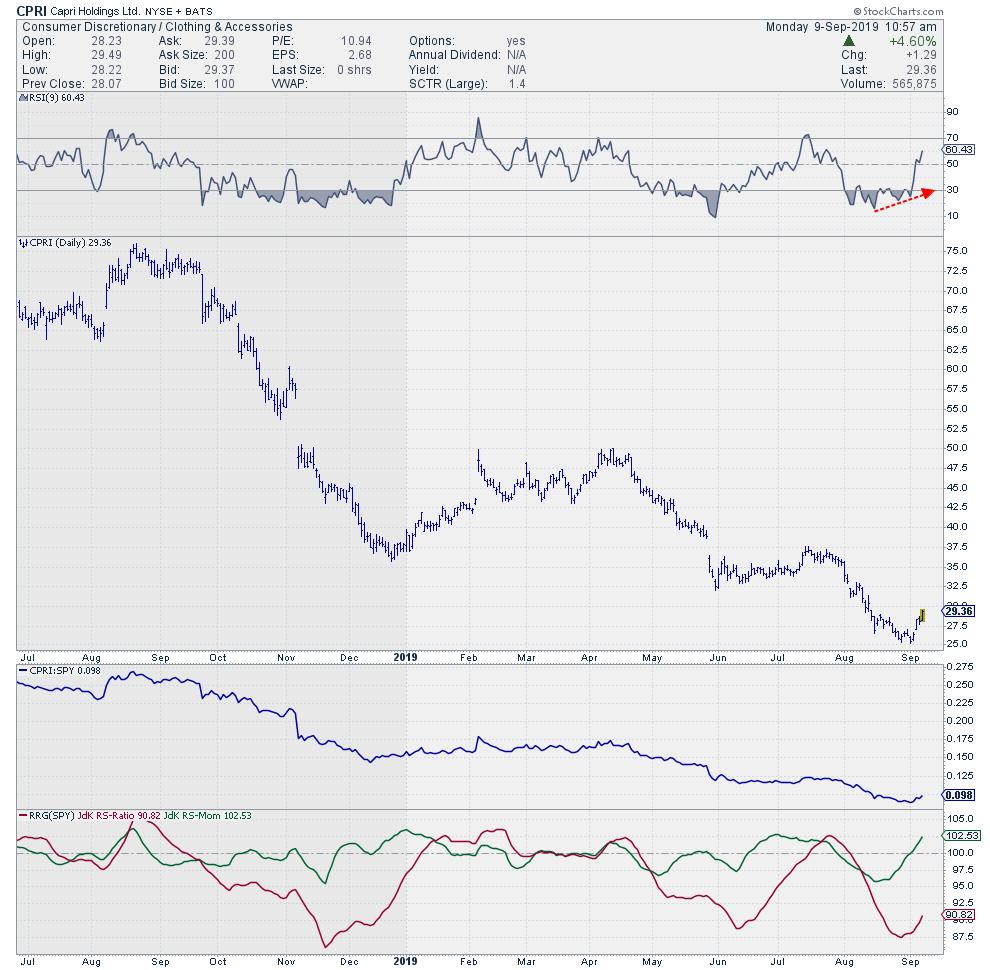
Capri Holdings Ltd. - CPRI
Helmerich & Payne Inc. - HP
Franklin Resources Inc. - BEN
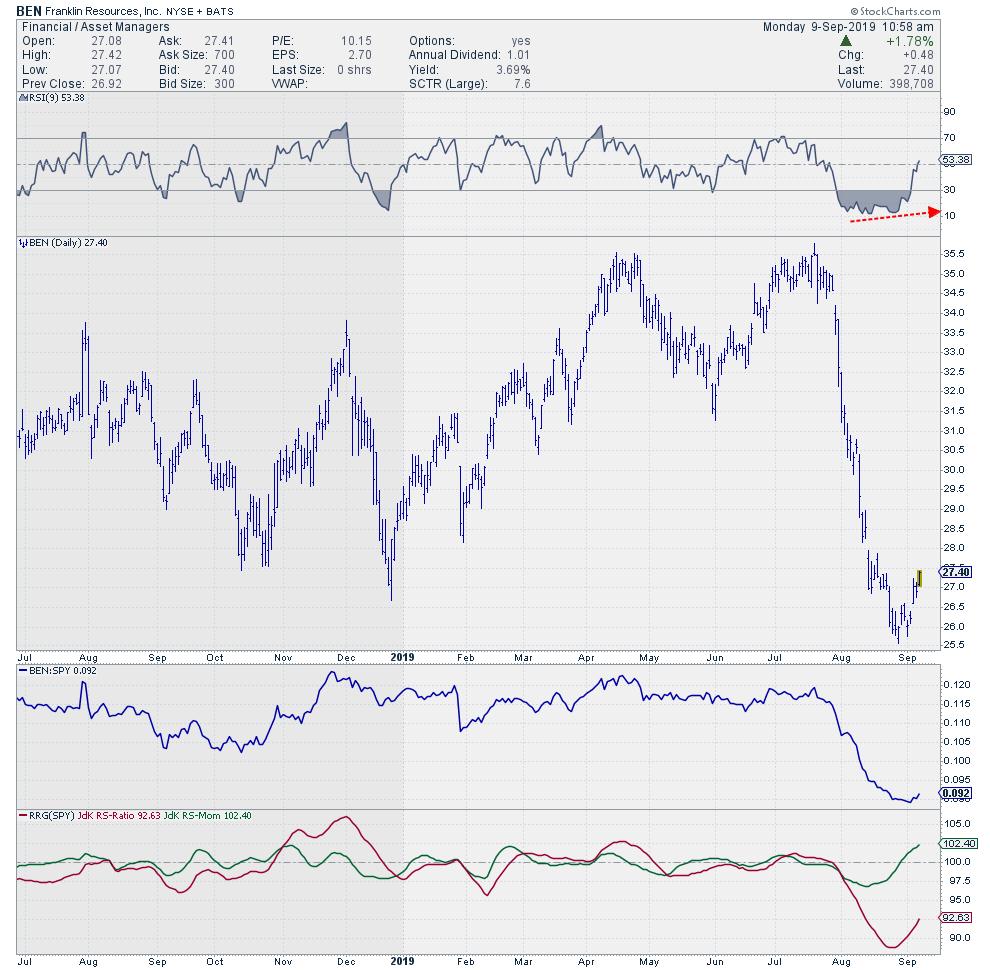
As usual, there are no guarantees, but the combination of scanning for stocks that have tanked and then started to level off/consolidate and, at the same time, are starting to pick up relative strength (strong rotation on RRG) at least gives us some interesting names for further study.
-Julius
Let me know what you think of this usage of RRG in the comments below. If you would like to receive a notification when a new RRG Charts blog article is published, simply subscribe with your email address using the form below.
Julius de Kempenaer
Senior Technical Analyst, StockCharts.com
Relative Rotation Graphs Founder, RRG Research
Want to stay up to date with the latest market insights from Julius?
– Follow @RRGResearch on Twitter – Like RRG Research on Facebook – Follow RRG Research on LinkedIn – Subscribe to the RRG Charts blog on StockCharts
Feedback, comments or questions are welcome at Juliusdk@stockcharts.com. I cannot promise to respond to each and every message, but I will certainly read them and, where reasonably possible, use the feedback and comments or answer questions.
To discuss RRG with me on S.C.A.N., tag me using the handle Julius_RRG.
RRG, Relative Rotation Graphs, JdK RS-Ratio, and JdK RS-Momentum are registered trademarks of RRG Research.
Julius de Kempenaer
Senior Technical Analyst, StockCharts.com
Creator, Relative Rotation Graphs
Founder, RRG Research
Host of: Sector Spotlight
Please find my handles for social media channels under the Bio below.
Feedback, comments or questions are welcome at Juliusdk@stockcharts.com. I cannot promise to respond to each and every message, but I will certainly read them and, where reasonably possible, use the feedback and comments or answer questions.
To discuss RRG with me on S.C.A.N., tag me using the handle Julius_RRG.
RRG, Relative Rotation Graphs, JdK RS-Ratio, and JdK RS-Momentum are registered trademarks of RRG Research.
