
SPX Monitoring purposes; Sold SPX 7/24/18 & 2820.40= gain .57%; Long SPX 7/19/18 & 2804.49.
Monitoring purposes GOLD: Neutral.
Long Term Trend SPX monitor purposes; Sold long term SPX 7/16/18 at 2798.43= gain 2.95%; Long 6/29/18 at 2718.37.
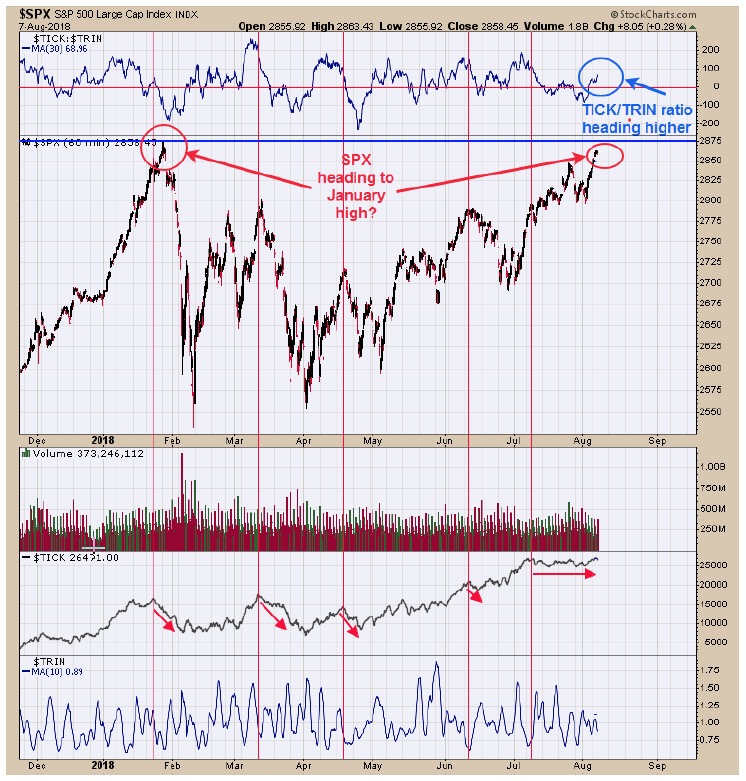 The SPX may be heading to its January high at 2872.87. The top window is the 30 hour average of the tick/trin ratio. Readings above “0” have been a bullish sign for the SPX and today’s close came in at +68.96. The second window up from the bottom is the hourly cumulative tick which has been going sideways since early July even though market has worked higher; this is a bearish sign. Neutral for now. Sold long SPX on 7/24/18 at 2820.40= gain .57%; Long SPX on 7/19/18 at 2804.49.
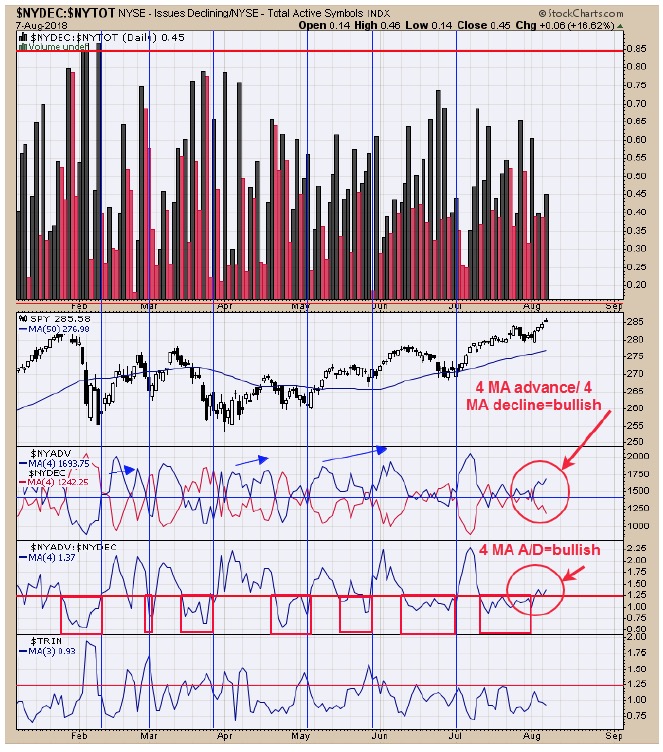 The SPY rally over the last four days keeps the 4 MA of the Advancing issues and 4 MA of the Declining issues on a bullish crossover and today’s trading even separated the 4 MA more which is bullish. Next window down is the Advance/Decline with a 4 period moving average. This indicator closed above 1.25 and turned bullish a couple of days ago and remains bullish today. SPX may be heading to its January top at 2872.87 and today’s close came in at 2858.45 just 14 point away. Market may work a little higher but not seeing a “Sign of Strength” to suggest much higher prices. Still expecting a pull back but may test January high first. Neutral for now.
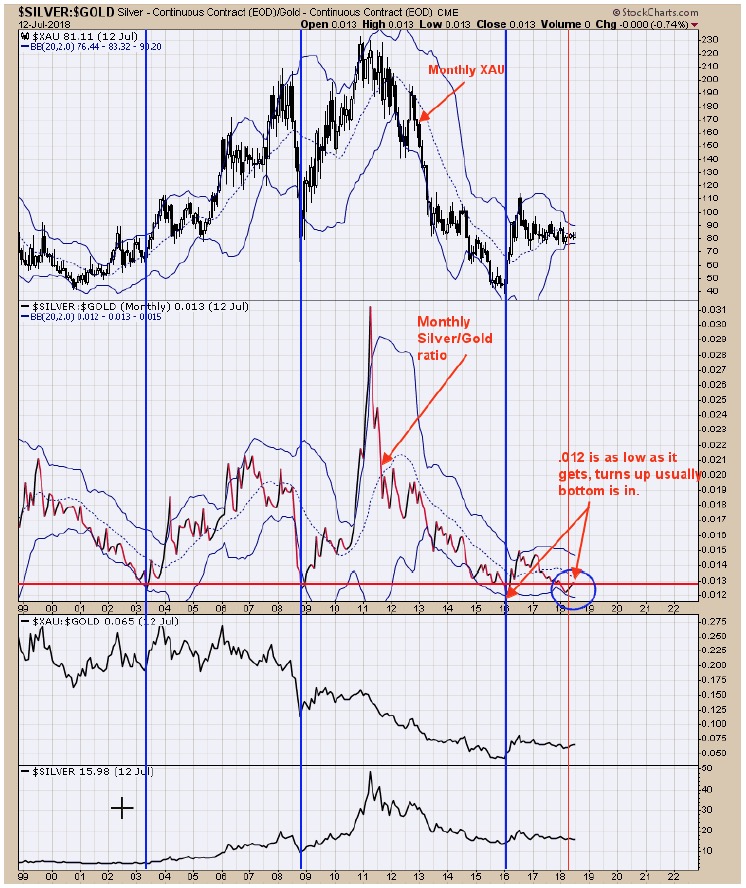 The chart above is the monthly Silver gold ratio going back to 1999 and updated to the current time. We have showed this chart in the past. Longer term bullish outcomes are expected for the XAU when the monthly Silver/Gold ratio turns up from below .013. The current bottom turned up from .012 around March of this year and the XAU is near the March close. The XAU hasn’t advanced or decline since March even though it has been kinda scary the last couple of weeks. Things can change but the monthly Silver/Gold ratio suggests a longer term bottom is forming in this area. The monthly charts rule the weekly charts and the weekly charts and the daily charts and if you got the monthly’s right than at some point the daily’s will come around. For now we need the daily momentum to turn up to gets us long and so far it hasn’t turned up. Gold commercials short position on the last report updated last Friday closed at 48K and the least short position going back to the December 2015 bottom. Major lows have formed in Gold when the Commercial position has been less than 100K. Market is still pounding out a low and momentum needs to turn back up to get long.
Tim Ord,
Editor
Visit www.ord-oracle.com. New Book release "The Secret Science of Price and Volume" by Timothy Ord, buy on www.Amazon.com.