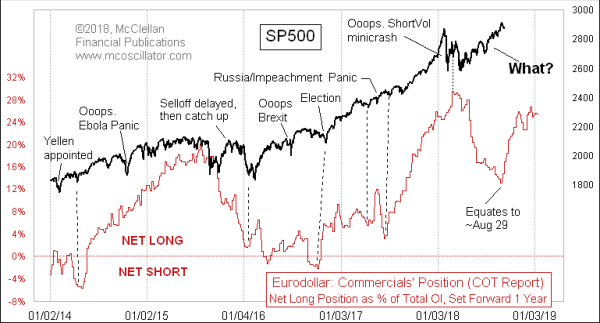
One of my favorite predictive models had me looking for a decent selloff in the summer of 2018, but the U.S. stock market decided not to participate. So what happened?
The model in this week’s chart contains data from the weekly Commitment of Traders (COT) Report, published by the CFTC. This data is on the eurodollar futures contract, the most liquid and widely traded of all futures contracts. I should emphasize that in this context, the term “eurodollar” is not a currency futures contract, but rather it refers to dollar-denominated time deposits in European banks. So it is an interest rate futures contract, which major banks utilize to hedge their deposit and loan balances.
The net position of the big-money commercial traders of eurodollar futures turns out to give a really good 1-year leading indication of what stock prices are going to do. It is not a perfect leading indication, just a really good one.
Occasionally an exogenous event like the Brexit vote or the Ebola Panic can throw the stock market off track from what this model suggests should have happened. When that occurs, the stock market usually works extra hard to get itself back on track. That is how it normally works.
In 2018, we have seen a strange deviation from the model, with the market trending upward for several months instead of pulling back as the model suggested. This is somewhat reminiscent of a similar inversion which occurred back in 2013:
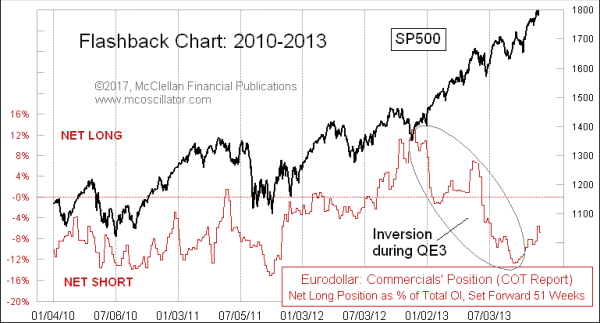
Back then, the Fed started “QE3” the third round of quantitative easing which pumped $85 billion per month into the banking system. All of that extra liquidity seems to have helped the stock market avoid a pretty significant decline that year, which the eurodollar COT model had suggested should have happened. It is arguably a good thing that the Fed fended off a bear market, and the associated economic damage. But it sure made things hard for me to figure out back then as the inversion was happening.
We don’t have QE now, and indeed the Fed is doing the opposite, selling off some of its holdings of T-Bonds and mortgage backed securities. Removing liquidity from the banking system should have the effect of compounding the negative message from the eurodollar COT model. But yet the U.S. stock market has rallied this summer. So what gives?
It turns out that the summer selloff which the eurodollar COT model had forecasted really did show up, but not in the U.S. Other world markets saw the decline pretty much on schedule. Here, for example, is Brazil’s Bovespa Index compared to this same model. It has moved pretty much in sync with the pattern.
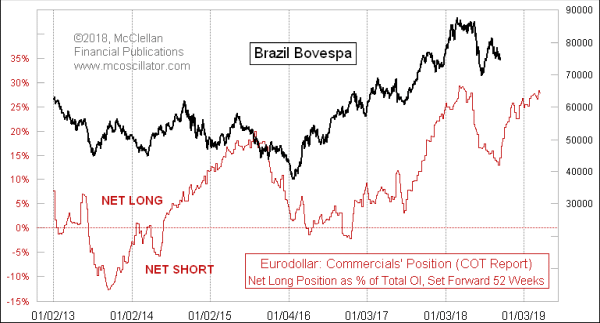
Most of the world’s stock markets are generally correlated to the SP500, and so a leading indication which (usually) works for the SP500 should also generally work for the other markets. So the correlation of the Bovespa to the eurodollar COT pattern is not a surprise. What is the surprise is that the U.S. stock indices did not decline.
Here is another example:
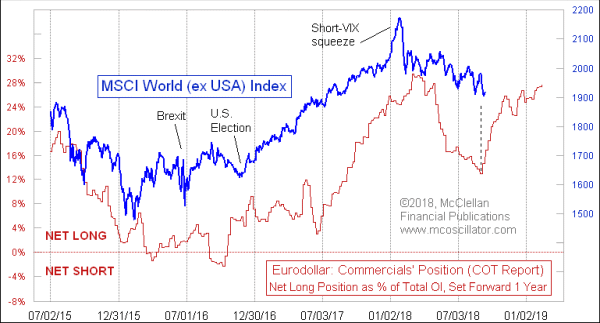
The MSCI World (ex USA) Index is a good representation of what the rest of the world’s stock markets are doing en masse, and its decline in 2018 arrived right on schedule according to the eurodollar COT model’s message.
The same thing happened among the emerging markets, as modeled here by EEM, the largest of the ETFs that track such markets:
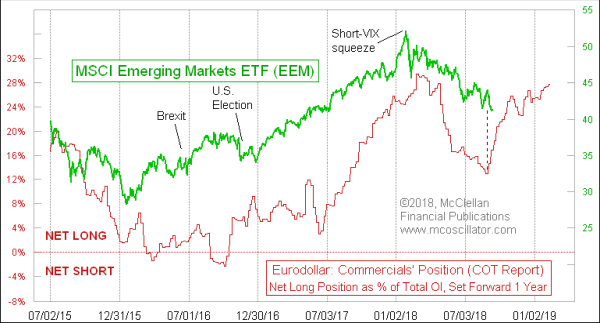
7 of the top 10 holdings in EEM are based in China, whose stock market has had a tough time in 2018 on dollar strength and tariff worries. China has also been vigorously devaluing the yuan in 2018, which has affected its stock prices. And here again, the decline has been right on schedule according to the eurodollar COT model.
Now this model says all of these markets ought to see a vigorous upturn into 2019. So the question is whether the SP500 has already pulled forward all of those gains by having them early in the summer? Or will it be able to rally in the bullish phase of this model because it was strong during the weak phase?
As for the question of why the SP500 was able to be strong in 2018 when the rest of the world was weak, the most likely explanation is that the tax cuts which went into effect early in the year are helping to provide the liquidity to the U.S. stock market even though the eurodollar COT model said that liquidity should be waning now. The change in tax treatment of overseas profits by U.S. companies has made it more attractive to bring some of that money back to the U.S. where it can be put to work boosting stock prices, among other activities.
Here is some data from a Sep. 4, 2018 Federal Reserve paper by Michael Smolyansky, Gustavo Suarez, and Alexandra Tabova, quantifying how much of a change we have seen:
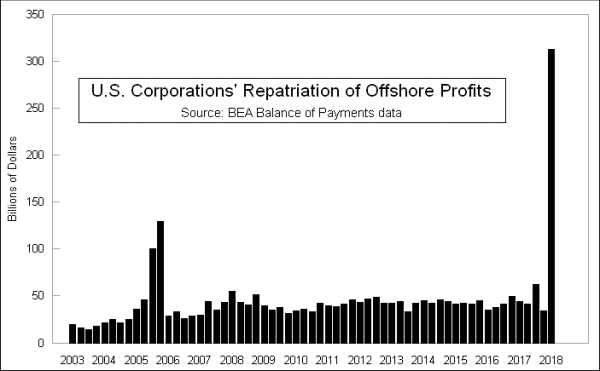
Their data only go through Q1 of 2018, so we do not have the complete up-to-date picture. That first quarter under the new tax laws saw repatriations jump up to $313 billion. That amount of money dwarfs the magnitude of the Fed’s quantitative tightening (QT), which is just now up to $40 billion a month. And it helps to explain why countries which have seen money taken from their banking systems to repatriate back to the U.S. have seen their stock markets decline while the U.S. stock market has gone higher.
Eventually all of the money that is going to get repatriated due to this tax change will have done so, and the rate of repatriation will decay back down toward more normal levels. That may already be happening even now, and it should allow the SP500 to start tracking again with the eurodollar COT model.
Just ahead, the eurodollar COT model shows a change to a bullish phase into 2019, which fits well with the switch to bullish seasonality, and the start of the normally-bullish 3rd year of the presidential term. So it should be a much more positive time for the world’s stock markets.
Tom McClellan,
Editor
The McClellan Market Report
www.mcoscillator.com
