SPX Monitoring purposes; Neutral.
Monitoring purposes GOLD: Long GDX on 1/29/19 at 21.96.
Long Term Trend SPX monitor purposes; Long SPX on 10-19-18 at 2767.78
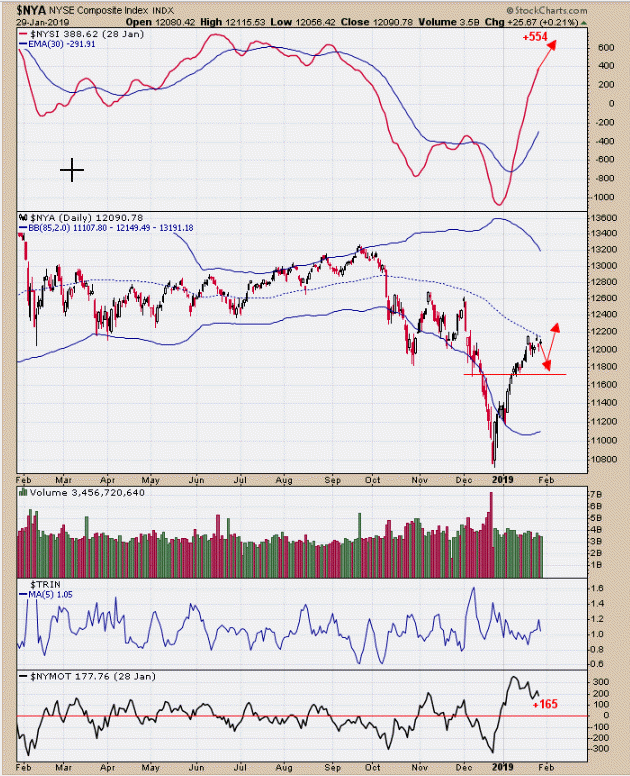
 The top window in the chart above is the NYSE McClellan Summation index. When this index reaches above +500 (today’s close was +554), it is implied the market has reached “escape velocity” and a new uptrend has started. There can be corrections that follow, but overall higher prices are expected and it is an intermediate-term bullish sign.
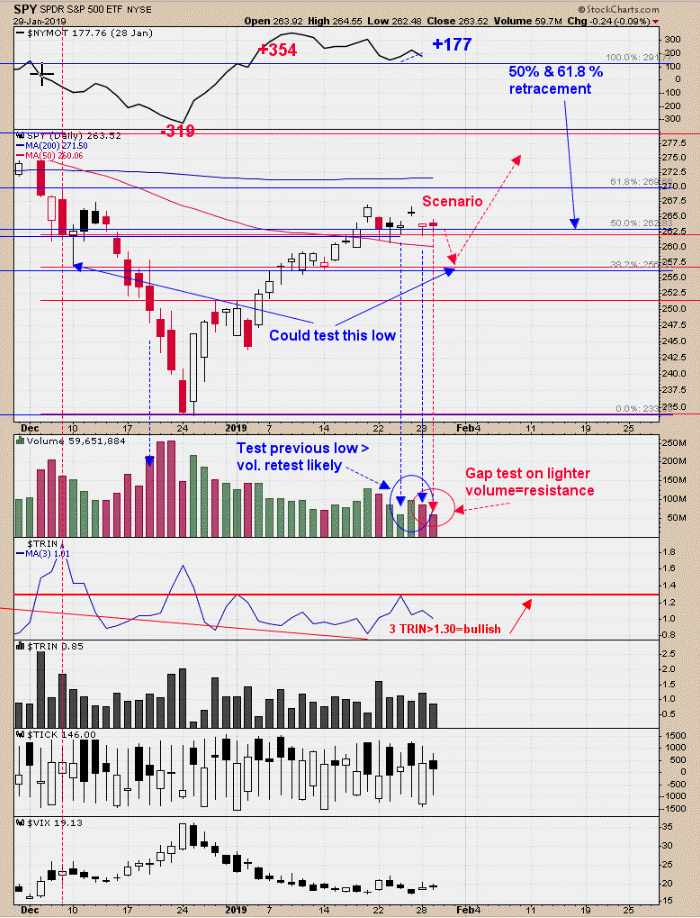
 Yesterday’s low tested last Thursday’s low on higher volume and suggests yesterday’s low will at least be tested again - and it could go lower. Today high tested yesterday’s gap on lighter volume and suggests that the gap has resistance. With yesterday’s low testing last Thursday's low and today's gap test on lighter volume, it suggests tomorrow's FOMC meeting announcement day will be a down day. How much down we don’t know, but it could test the December 10 low near the 257 SPY range. The last seven announcements by Chairman Powell were down; will number eight be down also? The equity Put/Call ratio closed yesterday at .76, which suggests a higher market within 5 days out of being higher 88% of the time with average gain of 1.3%. For a bullish setup, it is needed for the TRIN to close greater than 1.30 and the TICKs to close less than -300 and near the December 10 low. The bigger picture is bullish and waiting for a setup in the short term.
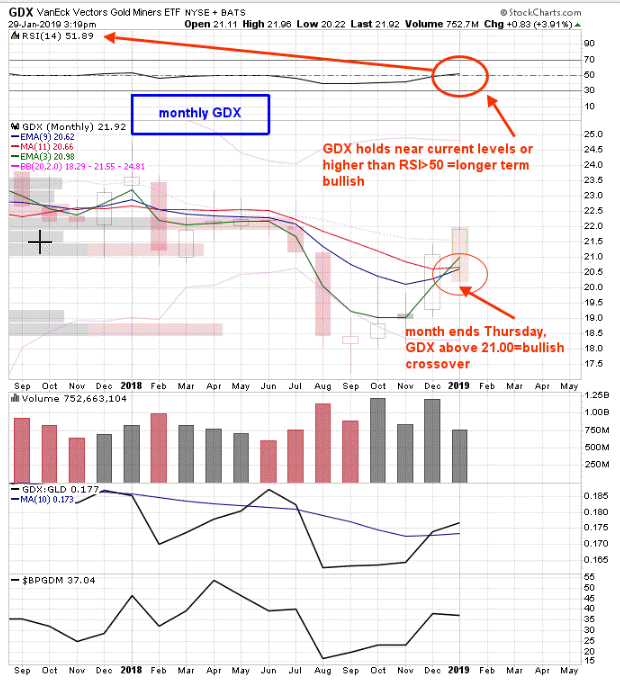
 The FOMC meeting is today and tomorrow with the announcement at 2:00 Wednesday. Above is the monthly chart of GDX. The month of January ends on Thursday (two days away). A monthly RSI close above 50 (current reading is 51.93) is a bullish longer-term signal. The middle window is the monthly GDX with the moving averages of 3, 9 and 11. When all three cross (in this case, cross to the upside) a bullish longer-term signal is triggered. A close below 20.50 could change these bullish signals back to neutral on Thursday. GDX has been up five months in a row (strength follows strength) and suggests further strength to come. If the market pulls back to 20.50 on Thursday, then we will have to reconsider the bullish picture. Long GDX on 1/29/19 at 21.97.
Tim Ord,
Editor
www.ord-oracle.com. New Book release "The Secret Science of Price and Volume" by Timothy Ord, buy at www.Amazon.com.
