SPX Monitoring purposes: Long SPX on 6/25/19 at 2917.38.
Monitoring purposes GOLD: Long GDX on 1/29/19 at 21.96.
Long Term Trend SPX monitor purposes: Sold long SPX on 5/6/19 at 2932.61= gain 5.96%.
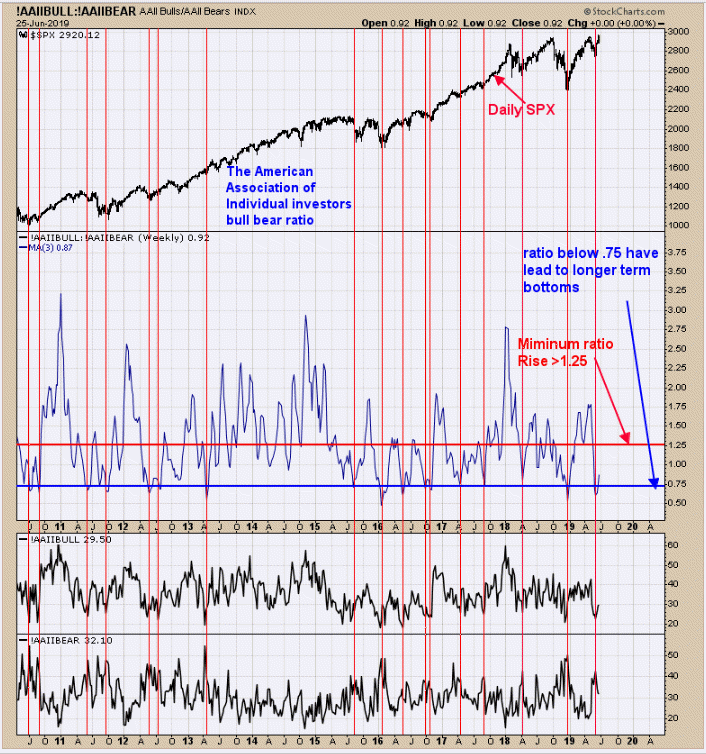
 The chart above is the three-week moving average of the American Association of Individual Investors Bull/Bear Ratio, going back to late 2010. We have been showing this chart recently because is relative to the current timeframe. We previously said that “[i]ntermediate-term rallies have occurred in the SPX when this ratio reached .75 and lower. The most recent low reading came in at .53 on June 3; it currently has bumped up to .87. Going back to 2010, this ratio reached at least 1.25 before any worthwhile SPX top formed. This week could see a retracement in the SPX, but, in general, the market should move higher in the coming weeks. We will be looking for a bullish setup in the coming days.” Today’s pull back did produce a bullish setup.
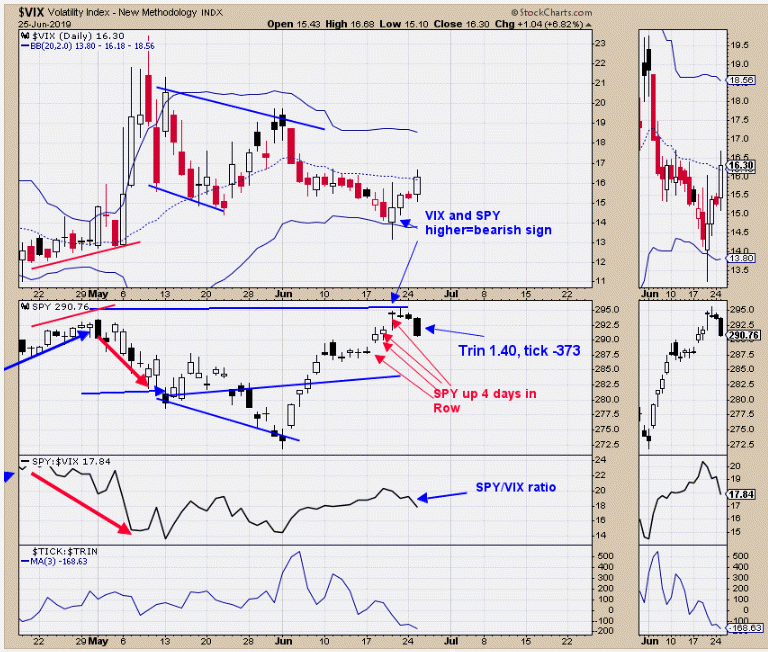
 The SPY was up four days in a row going into last Thursday. When the SPY is up four days in a row, it closes higher within the next five days 87% of the time, with an average gain of 1.1%. Also on today’s decline, the TICK and TRIN did reach panic levels, which suggests a low is being reached from today to as late as two days later (which would be Thursday). July 4 is next Thursday (markets are closed) and holidays commonly produce reversals in the market. We wouldn’t be surprised if market rallied to the July 4 timeframe. (Long SPX on 6/25/19 at 2917.38.)
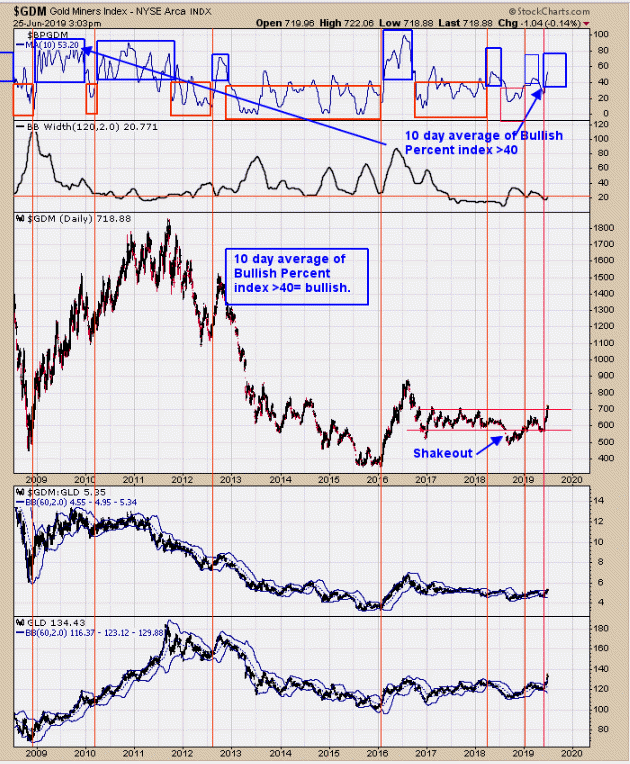
 The top window is the Bullish Percent index for the Gold Miners index with a 10-period moving average. The Bullish Percent Index measures the percent of stocks in an index that are on “Point & Figure” buy signals. When the 10-period moving average of the Bullish Percent Index rises above 40%, a bullish signal is generated for the Gold Miners Index. The red vertical lines show when bullish signals were generated in the past. The current read is 53.20%. Some of these bullish and bearish signals in the past have lasted for months. As long as the 10-period moving average of the Bullish Percent Index for the Gold Miners index remains above 40%, the uptrend should continue. Long GDX on 1/29/19 at 21.97.
Tim Ord,
Editor
www.ord-oracle.com. New Book release "The Secret Science of Price and Volume" by Timothy Ord, buy at www.Amazon.com.
