
SPX Monitoring purposes: Sold long SPX on 8/19/19 at 2923.65 = gain 2.67% : long 2847.60 on 8/15/19.
Monitoring purposes GOLD: Long GDX on 1/29/19 at 21.96.
Long Term Trend SPX monitor purposes: Sold SPX 7/5/19 & 2990.41= gain 2.63%.
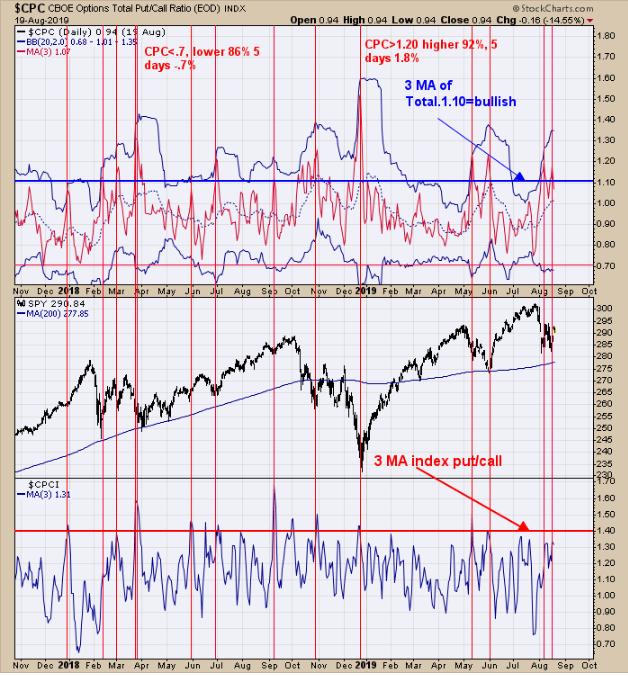
Our intermediate-term view of the market remains bullish. Yesterday, we presented the "The American Association of Individual Investors Bull Bear Ratio" with a three-period moving average that reached bullish levels. The top window in the chart above is the "Three Period moving average of the Total Put/Call ratio." Readings near 1.10 and higher have appeared near intermediate-term lows in the SPX. These levels have been reached starting back at the first low on August 5. The market could back and fill for a while before the intermediate-term rally begins, but, all in all, the market is making an intermediate-term low is this region. Sold long SPX on 8/19/19 at 2923.65 = gain 2.67%.
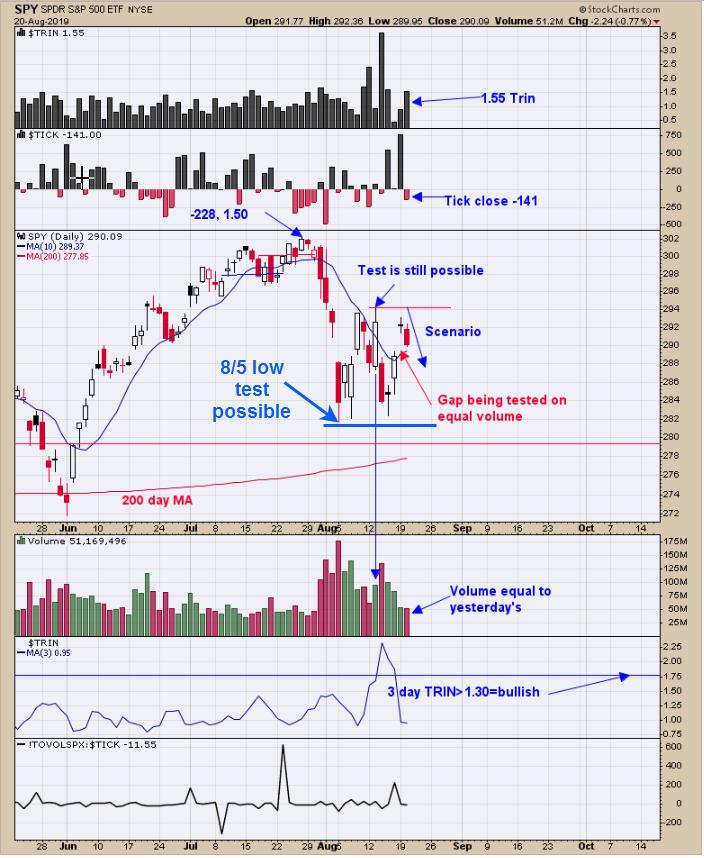
The market is coming off a high with bearish TICK and TRIN readings, which can be a bearish sign. Today, the TRIN closed at 1.55 and the TICKs at -141, which is a bullish combination after a market has declined for a few days, but can be a bearish sign right after a high is reached. On July 29, the TRIN closed at 1.50 and the TICKs closed at -228, and the August slide began that climaxed at the August 5 bottom. Therefore, the current TRIN and TICK readings can be a bearish sign here. Today's decline went into yesterday's up gap on equal volume, suggesting the gap is not producing support. The market could possible test the previous high of August 13 before heading lower, but that is not required. At some point, the 8/5 low may be tested before a longer-term bullish setup may materialize. Sold our long SPX position for a 2.67% gain.
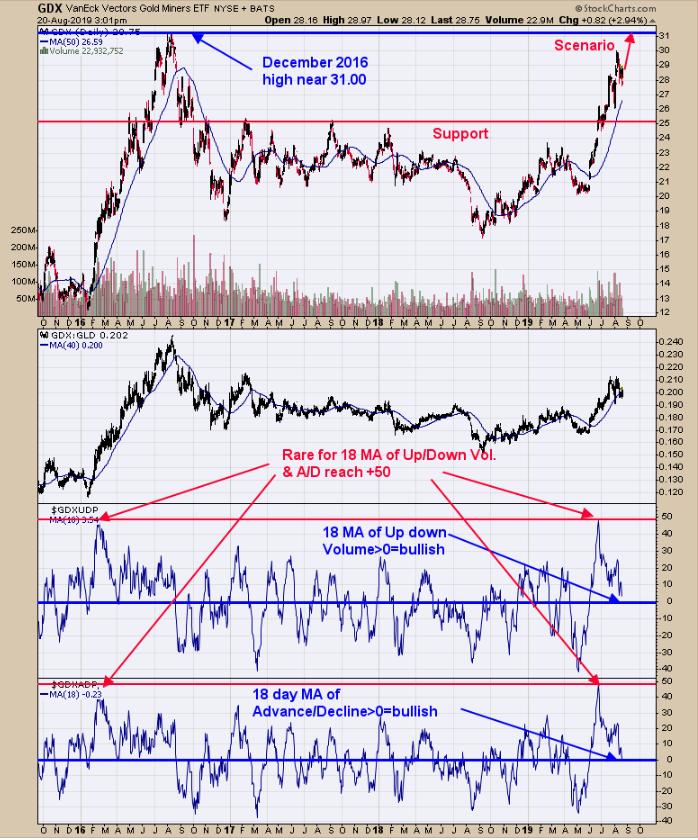
We have updated this chart from yesterday. The bottom window is GDX Advance/Decline with an 18-period moving average. The next window up is GDX UP Down Volume with an 18 period moving average. As long as both indicators remain above "0", the trend is considered up for GDX - and in general, both are. Notice that, on the surge from the May low, both indicators reached +50, which also occurred back at the major rally of 2016. We went back 10 years and looked for other times when both indicators reached +50 and found none. Though the occurrences are rare, the current +50 readings on both indicators do suggest a similar period like the early 2016 rally may be in progress. It common for market reversals to appear around holidays and FOMC meetings. The next holiday is Labor Day, September 2, and the next FOMC meeting is September 17-18. Long GDX on 1/29/19 at 21.97.
Tim Ord,
Editor
www.ord-oracle.com. New Book release "The Secret Science of Price and Volume" by Timothy Ord, buy at www.Amazon.com.