
I pay close attention to the weekly COT report, especially when any of the reporting groups (commercial hedgers, large speculators, small speculators) are at a record position, long or short. Last Friday's release of the Commitment of Traders report (COT) showed that, in the gold market, commercials are at a record short position (futures and options) while large speculators (hedge funds) are at a record long position. In the metals space, the commercials are the smart money. If interested, go take a look at silver in April, 2017, when commercials hit a record level of short interest and silver, soon thereafter, fell 14%.
Besides the COT report, there are a couple of other signs I see of a correction coming in gold. The chart below shows gold (gold bars) and the inverse 10-year Treasury yield (TNX, green line). The second panel shows where gold is in relation to its Bollinger Band (BB) on a monthly basis. The red line at 1.0 shows when gold is at the top of the BB. Any time the black line is higher than the red horizontal line, it means that gold is trading above the upper BB, an indication of extreme volatility. The third panel is a monthly bar chart of gold, while the bottom panel shows the 1-year correlation between gold and the 10-year yield. The red vertical lines mark the times since 1980 that the monthly gold price has broken above the upper BB on an up move in price.
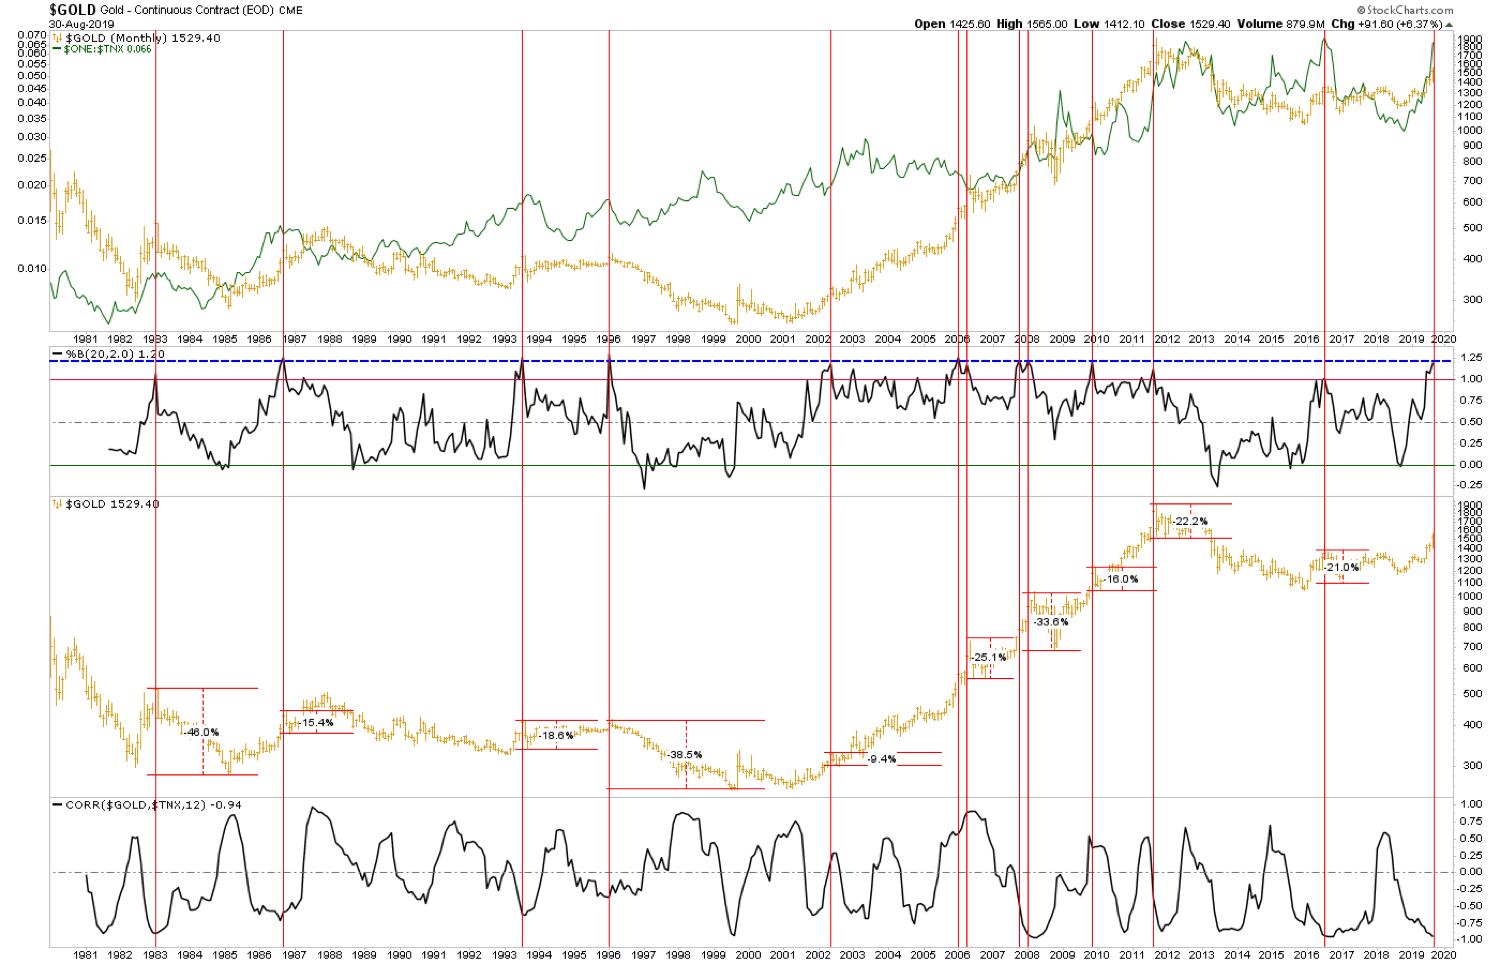
As you can see above, gold has had 10 prior instances where price has broken above the upper BB (this past month is the 11th instance). In each of these cases, there was a correction in gold. These corrections varied in both time and price, but the average correction was about 23%. The point of this exercise is to simply be aware that the move in gold has been extreme and that, when the price has exceeded the upper BB at the 1.2 level, a correction has occurred. As for quantifying "extended," this is the first time since gold peaked at $1900 that it has traded 15% above its 200-EMA.
For further confirmation of the above, I'll look at this chart below showing the inverted 10-year yield (TNX, green line) along with the price of gold (gold line). Using the same BB analysis, it is interesting to note that, of the 9 instances when rates traded at 1.3 above their monthly BB, they corrected 7 times and went sideways twice (bottom panel). If rates are due to correct, gold should correct as well.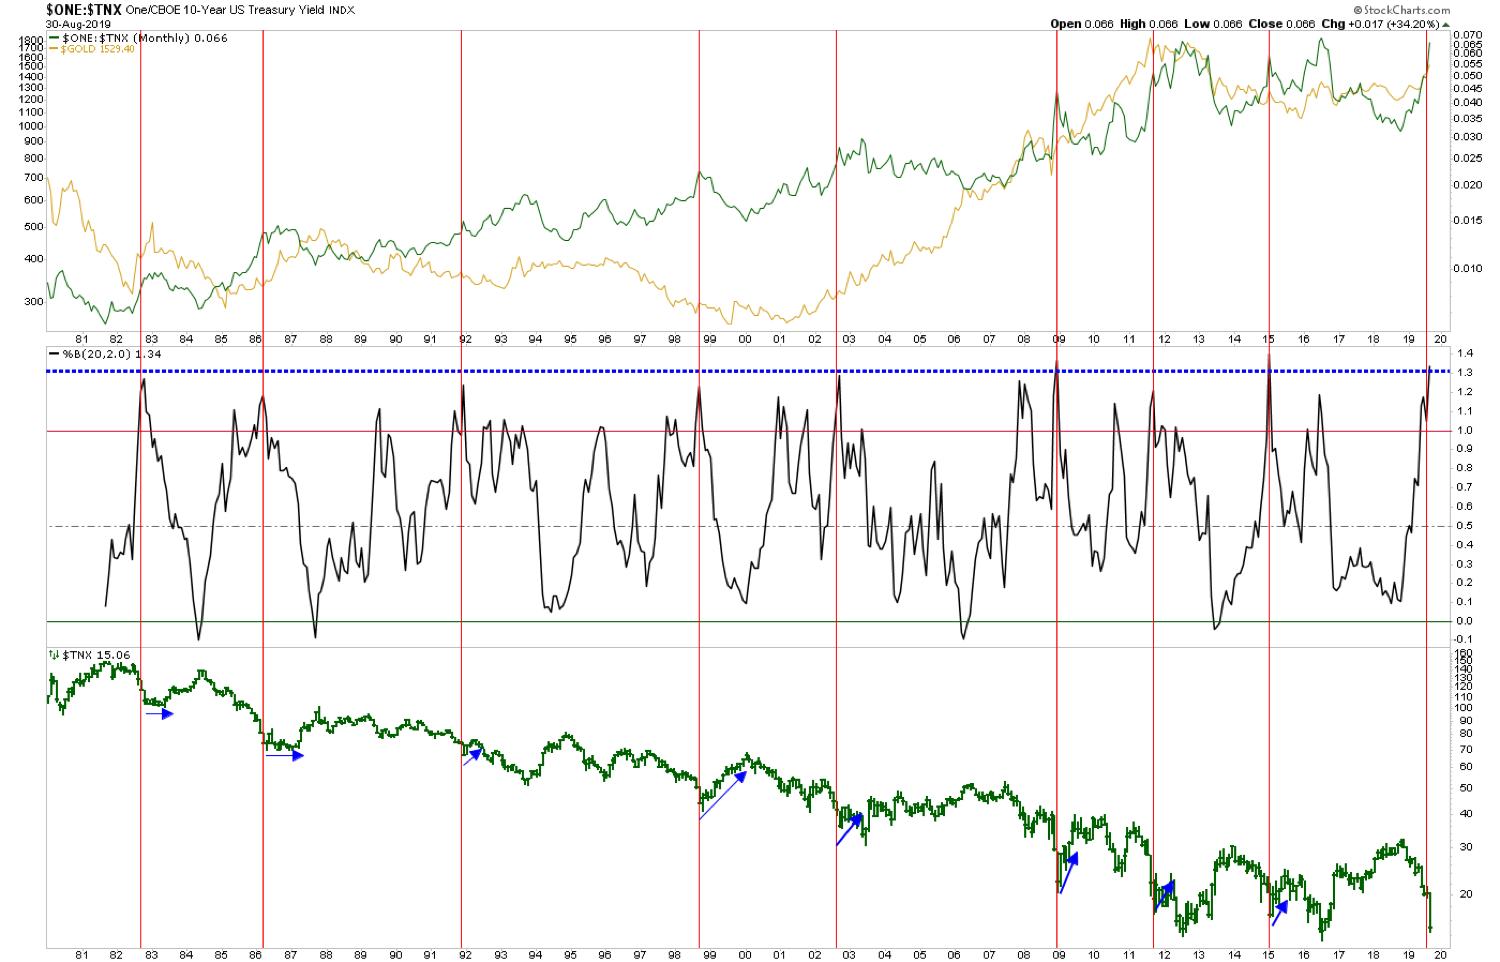
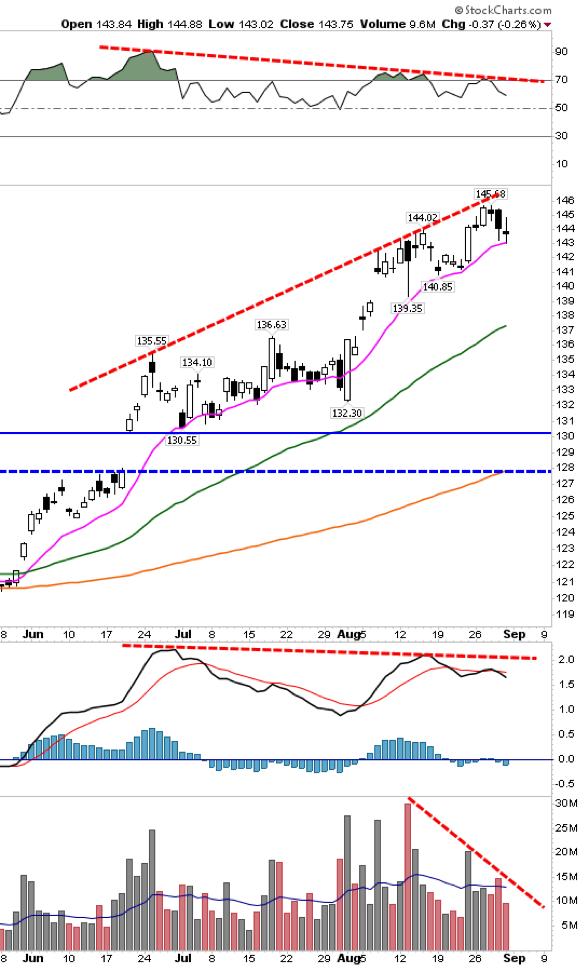
Looking at the daily chart of GLD, the negative divergences of price with volume, RSI (10) and MACD continue to grow. This can persist for a longer time, or be negated if prices rise further and these momentum indicators rise with price to new highs. But the warning signs of a correction are sounding:
There are many fundamental reasons for gold to continue higher from here: Trump tweets, the trade war with China, falling interest rates, inverted yield curve, $1.7 trillion in negative yield debt and a Fed that looks to be losing credibility. However, based on the technical indicators I have laid out above, I expect gold to correct lower before setting up the next leg higher.
Tim Taschler, CMT
Sprott USA
Past performance does not guarantee future results. The views and opinions expressed herein are those of the author's as of the date of this commentary and are subject to change without notice. This information is for information purposes only and is not intended to be an offer or solicitation for the sale of any financial product or service nor a recommendation or determination by Sprott Global Resource Investments Ltd. that any investment strategy is suitable for a specific investor. Investors should seek financial advice regarding the suitability of any investment strategy based on the objectives of the investor, financial situation, investment horizon and their particular needs. This information is not intended to provide financial, tax, legal, accounting or other professional advice, since such advice always requires consideration of individual circumstances. The products discussed herein are not insured by the FDIC or any other governmental agency, are subject to risks, including a possible loss of the principal amount invested.
Generally, natural resources investments are more volatile on a daily basis and have higher headline risk than other sectors, as they tend to be more sensitive to economic data, political and regulatory events as well as underlying commodity prices. Natural resource investments are influenced by the price of underlying commodities like oil, gas, metals, coal, etc., several of which trade on various exchanges and have price fluctuations based on short-term dynamics partly driven by demand/supply and also by investment flows. Natural resource investments tend to react more sensitively to global events and economic data than other sectors, whether it is a natural disaster like an earthquake, political upheaval in the Middle East or release of employment data in the U.S.. Low-priced securities can be very risky and may result in the loss of part or all of your investment. Because of significant volatility, large dealer spreads and very limited market liquidity, typically you will not be able to sell a low priced security immediately back to the dealer at the same price it sold the stock to you. In some cases, the stock may fall quickly in value. Investing in foreign markets may entail greater risks than those normally associated with domestic markets, such as political, currency, economic and market risks. You should carefully consider whether trading in low-priced and international securities is suitable for you in light of your circumstances and financial resources. Past performance is no guarantee of future returns. Sprott Global, entities that it controls, family, friends, employees, associates and others may hold positions in the securities it recommends to clients and may sell the same at any time. The author received no compensation for writing this article.