Market Recap for Thursday, June 15, 2017
There's been marked improvement in the relative strength of industrials (XLI, +0.60%) in recent weeks and that was on full display Thursday. Despite all of our major indices finishing lower, the XLI managed to end the session in positive territory and ahead of the remaining eight sectors. The only other sector to finish higher was the defensive utilities sector (XLU, +0.57%). In addition, the XLI passed healthcare (XLV, -0.10%) in terms of SCTR rank on Thursday after surpassing technology (XLK, -0.45%) earlier this week. The XLI's SCTR score of 86.5 now trails only the XLU, which currently has a 92.3 score.
The one week sector scoreboard is really interesting:
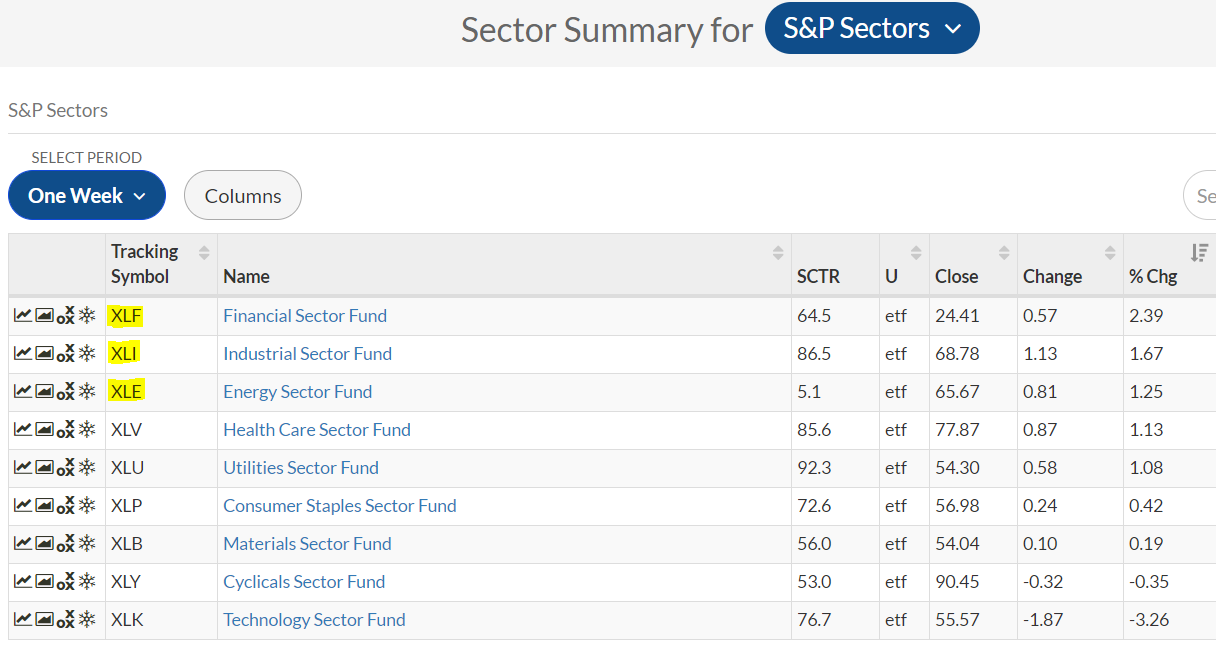 If you recall, it was the top three sectors here - XLF, XLI and XLE - that led the huge market advance in November and December. After months of selling in energy (XLE) and consolidation in both financials and industrials, the past week has shown that money has begun to rotate back to these three groups. Perhaps, this is the start of a bigger theme as we head into the summer months.
While both railroads ($DJUSRR) and airlines ($DJUSAR) look suspect on their longer-term weekly charts due to negative divergences, truckers ($DJUSTK) appear to be the transportation group of choice. Not only did they lead all industrial groups on Thursday, but they've recently broken their downtrend line and are acting much more bullishly, bouncing off rising 20 day EMA support. Check out the chart:
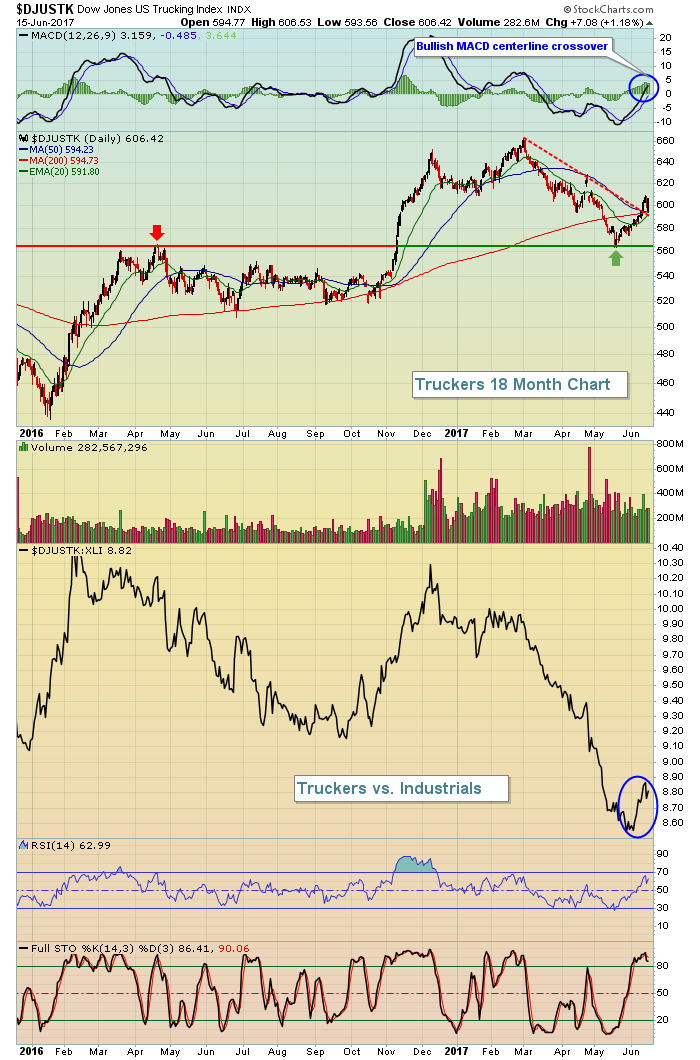 The two blue circles highlight the strengthening momentum and improving relative strength. During June, the DJUSTK has seen its best relative strength in months. Given the technical breakout and the cloudy picture in other transportation areas, I'd expect to see further absolute and relative strength from truckers during the summer.
Pre-Market Action
Crude oil ($WTIC) is slightly higher in an attempt to stop the bleeding of late. However, the poor housing report has lowered Dow Jones futures, which were up earlier. Currently, those futures are flat after Asian markets finished mixed overnight. European markets are mostly higher.
Current Outlook
The Dow Jones U.S. Home Construction Index ($DJUSHB) is likely to put pressure on discretionary stocks today, and perhaps the overall market. Both housing starts and building permits for May were reported this morning way below expectations and the failure to sustain a breakout into week's end now is leaving the group's technical picture rather ominous as well. Have a look:
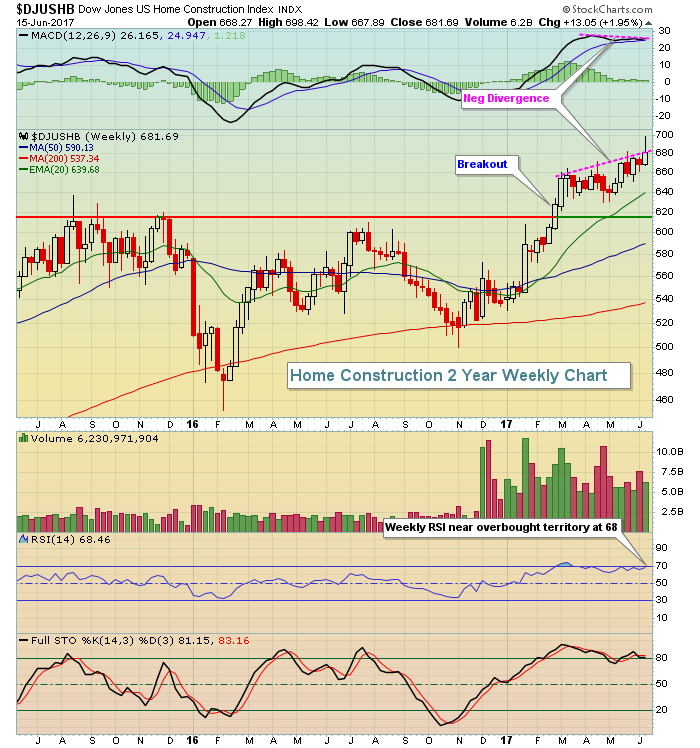 Keep in mind this is a weekly chart so that last candle for this week doesn't complete until today's close. With the DJUSHB expected to open lower after this morning's disappointing housing starts and building permits, that candle is likely to be of the topping variety with a long tail to the upside reflecting the failed attempt at a breakout with a negative divergence and nearly overbought conditions. Be careful.
Sector/Industry Watch
Industrials have seen renewed absolute and relative strength of late and they're gaining ground because of a few key industry groups, one of which is the Dow Jones U.S. Transportation Services Index ($DJUSTS). While the DJUSTS has been relatively weak vs. its peers, its relative strength has improved in the past few weeks, just as the group has cleared down channel resistance on its absolute chart. Also, note the improving momentum (bullish MACD centerline crossover) and increasing volume to support the move higher:
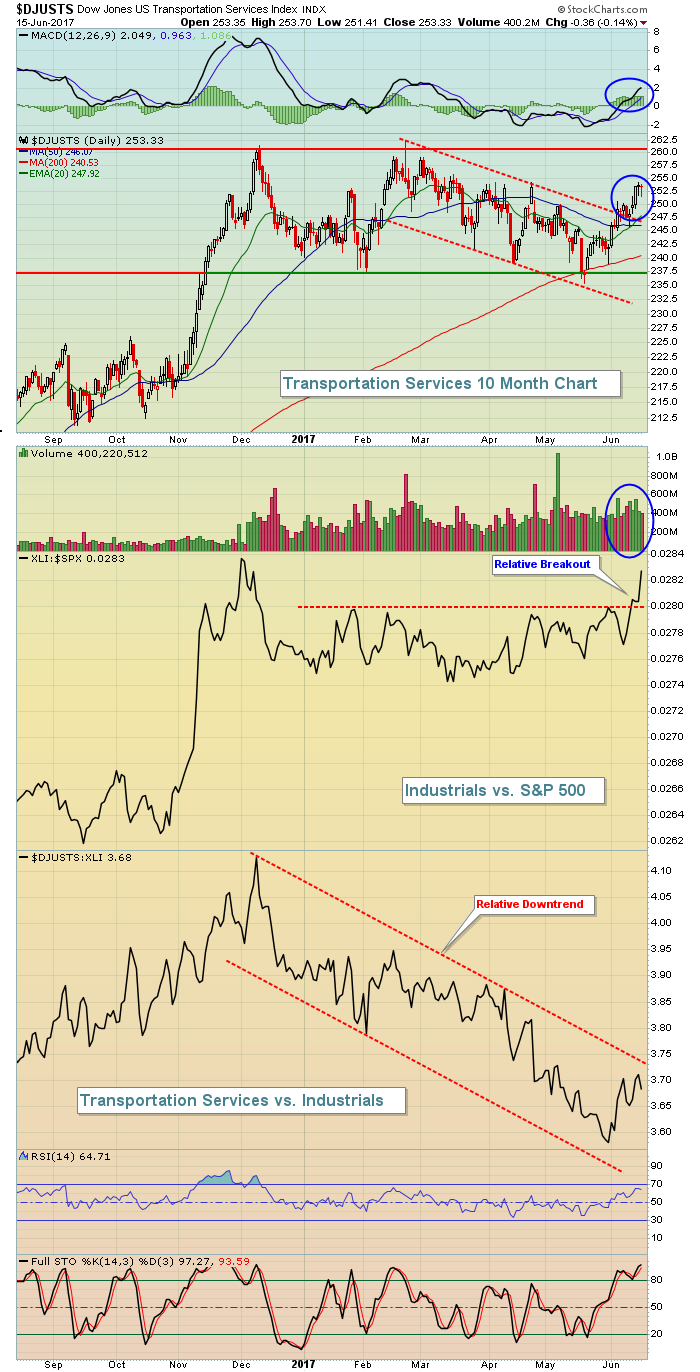 Industrials are improving. And transportation services, within industrials, are improving. That's a potent combination. The next critical test will be the DJUSTS:XLI relative ratio. It's currently mired in a relative downtrend. If that breaks, we should see additional rotation into this group.
Historical Tendencies
I discussed above the technical reasons for considering truckers on the long side. Seasonally, July is a strong month for the DJUSTK as it's risen on average 1.5% over the past 18 years. Here's a word of caution, however. August has been a historically bearish month for the group. Therefore, if the DJUSTK is able to fill its gap from late April near the 620 level, it'll be time to ring the register on a short-term trade and watch the August action from the sidelines. Here's the seasonal history on the DJUSTK:
 While July has risen 59% of the time over the past 18 years, August has risen just 24% of the time. August's average monthly loss of 2.4% is clearly the weakest among all calendar months.
Key Earnings Reports
None
Key Economic Reports
May housing starts released at 8:30am EST: 1,092,000 (actual) vs. 1,223,000 (estimate)
May building permits released at 8:30am EST: 1,168,000 (actual) vs. 1,249,000 (estimate)
June consumer sentiment to be released at 10:00am EST: 97.1 (estimate)
Happy trading!
Tom
