Market Recap for Monday, June 19, 2017
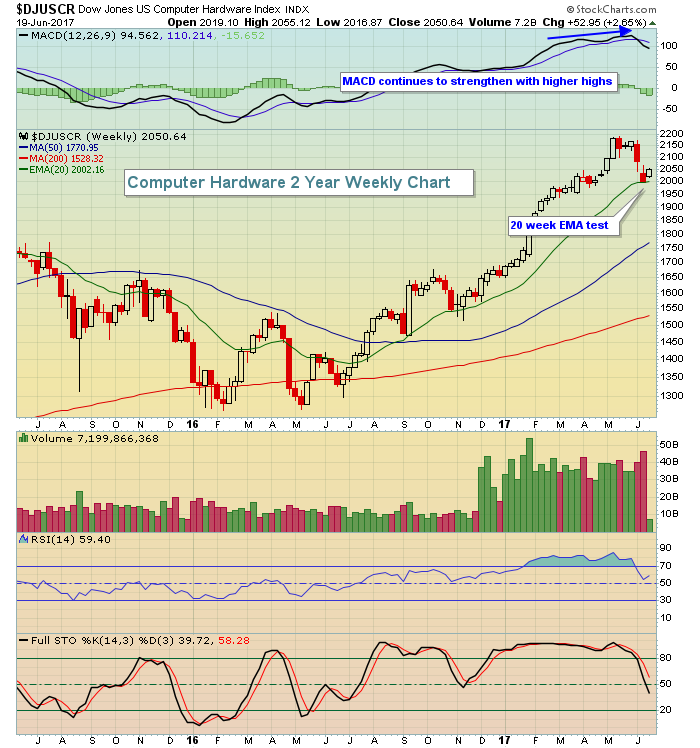
Technology (XLK, +1.48%), healthcare (XLV, +1.04%) and financials (XLF, +1.03%) led a broad-based rally on Monday that included seven of the nine sectors. Only energy (XLE, -0.63%) and the defensive utilities (XLU, -0.33%) failed to participate in the rally. While it was nice to see computer hardware ($DJUSCR) bounce off its rising 20 week EMA, I was much more closely watching the biotechs ($DJUSBT) for a significant breakout near 1800. Check these two charts out:
DJUSCR:
 DJUSBT:
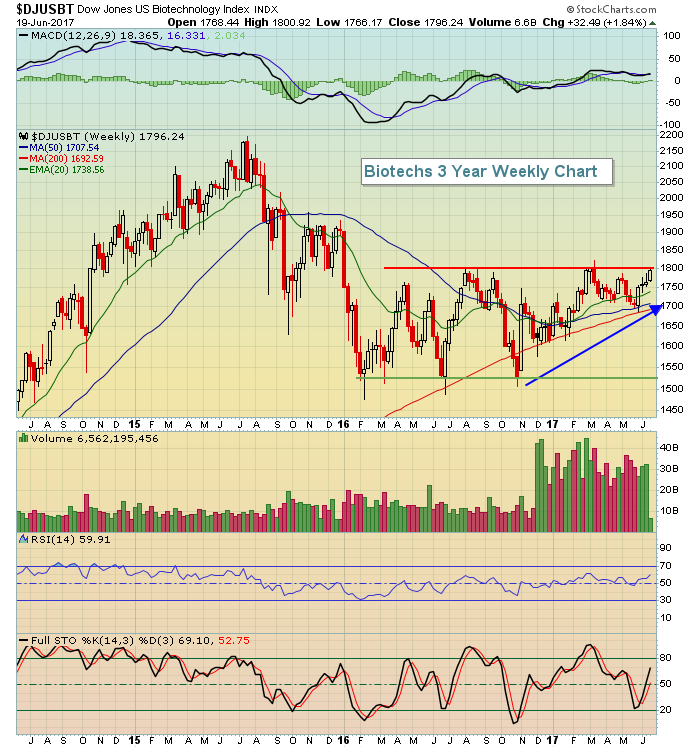 Biotechs tend to move quickly upon breakout so watch this group very closely. The IBB is an ETF that follows the DJUSBT closely for those not wanting the risk of individual stocks in this space.
Pre-Market Action
Crude oil ($WTIC) has fallen another 2.5% this morning and at a critical support level near $43 per barrel. A further drop could result in crude falling to its next key level of support near $39 per barrel. Energy (XLE) will be hard-pressed to rise with crude struggling like it is.
The Tokyo Nikkei ($NIKK) had a nice gain overnight, but otherwise most global markets were close to their flat lines. This morning, there's little to trade off of in terms of economic news so it'll be about the technical conditions. Currently, the Dow Jones is set to open flat with less than 30 minutes to the opening bell.
Current Outlook
Consumer spending accounts for roughly two thirds of the U.S. economy. That's one reason why I believe it's important to periodically review which segment of consumer stocks is leading the market. The consumer discretionary (XLY) sector represents stocks that account for aggressive consumer spending (homes, autos, restaurants, etc). When this group is outperforming its consumer staples (XLP) counterparts, it's a signal that traders expect a strong economy, or at least an improving one. Below is a chart of the S&P 500, with the consumer stocks relative ratio (XLY:XLP) beneath it:
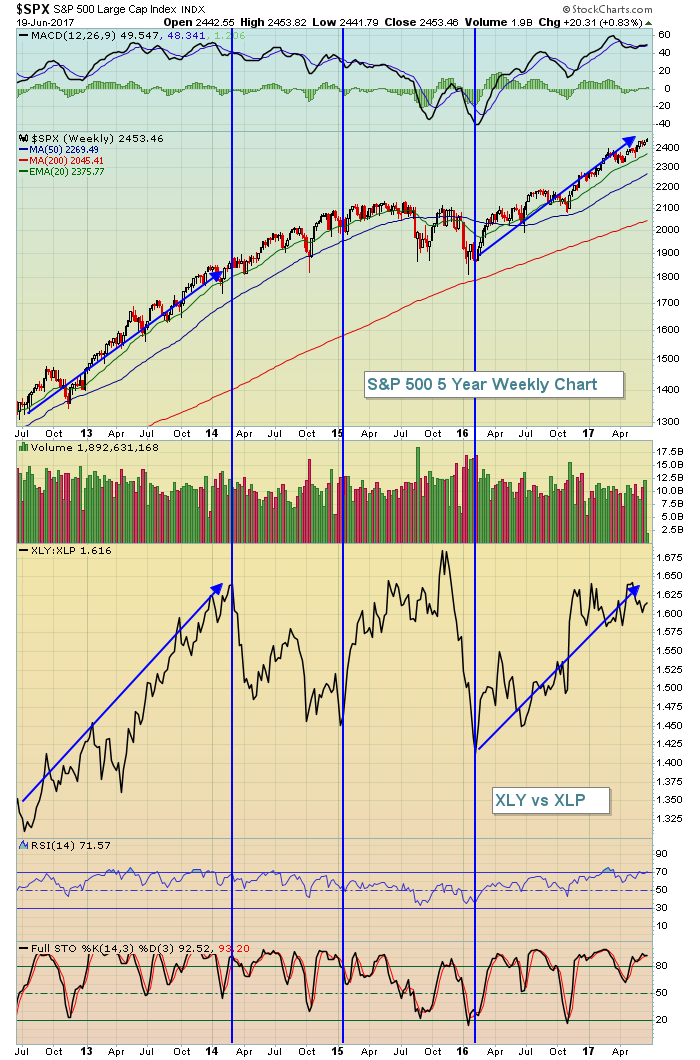 The action the past 18 months has been quite bullish with money rotating towards the more aggressive XLY as the S&P 500 moves higher. In my view, this is great action and supports the notion that the bull market advance is sustainable. A breakout on the XLY:XLP ratio above 2017 highs just beneath 1.65 would be further confirmation that the bull market is alive and strong.
Sector/Industry Watch
Technology (XLK) is clearly a sector to watch. After leading the S&P 500 for many months, we saw technical deterioration on the daily chart as the rising 20 day EMA was lost on very heavy volume. However, the 50 day SMA was never lost and the weekly chart remains quite bullish. Take a look:
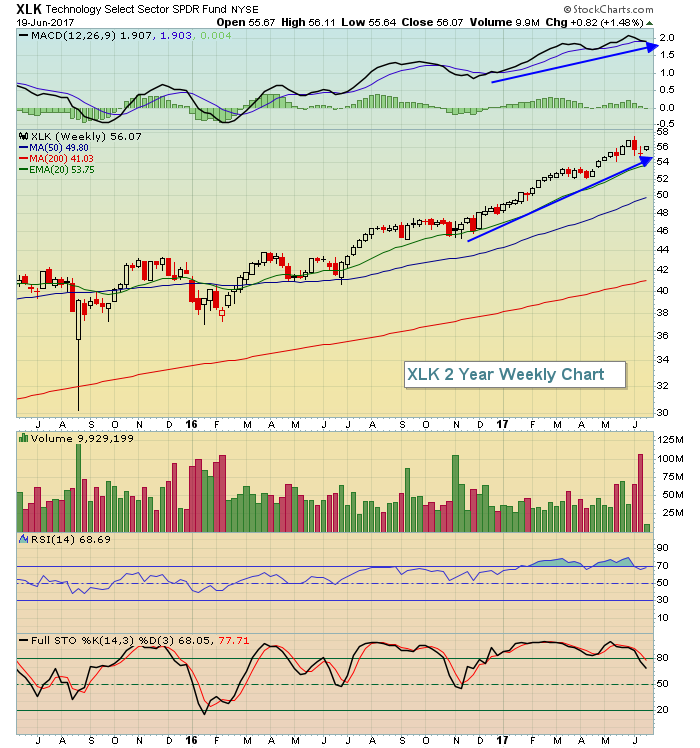 On this weekly chart, the selling in June looks like a blip on the radar. If anything, it enabled the XLK to move, at least temporarily, out of overbought territory. The group, quite honestly, could use some more selling down to the rising 20 week EMA to help relieve the overbought weekly oscillators a bit more.
Historical Tendencies
The NASDAQ had its best day of 2017 and the timing was interesting. First, it occurred on a Monday, when stocks typically struggle. Second, it occurred during the time of the calendar month (19th to 26th) when we generally see profit taking. History provides us no guarantee, just a foot print. This is definitely a seasonally weak period for the NASDAQ as June 18th through June 26th has produced annualized returns of -23.13% since 1971.
Key Earnings Reports
(actual vs. estimate):
LEN: .91 vs .78
(reports after close, estimate provided):
ADBE: .77
FDX: 3.89
RHT: .34
Key Economic Reports
None
Happy trading!
Tom
