Market Recap for Thursday, December 7, 2017
December began with a huge intraday selloff and recovery and since then, it's been mostly down action. Yesterday was the first day this month that the bulls could celebrate and feel good. Eight of nine sectors advanced with many of the aggressive sectors leading the charge. So while the S&P 500's modest gain of 0.29% might not have felt great, knowing that industrials (XLI, +0.92%) and technology (XLK, +0.62%) were among the leading sectors certainly helped to ease the recent pain. Industrials, after printing a 60 minute negative divergence, saw a MACD centerline reset and a 50 hour SMA test prior to resuming its uptrend - a bullish short-term development:
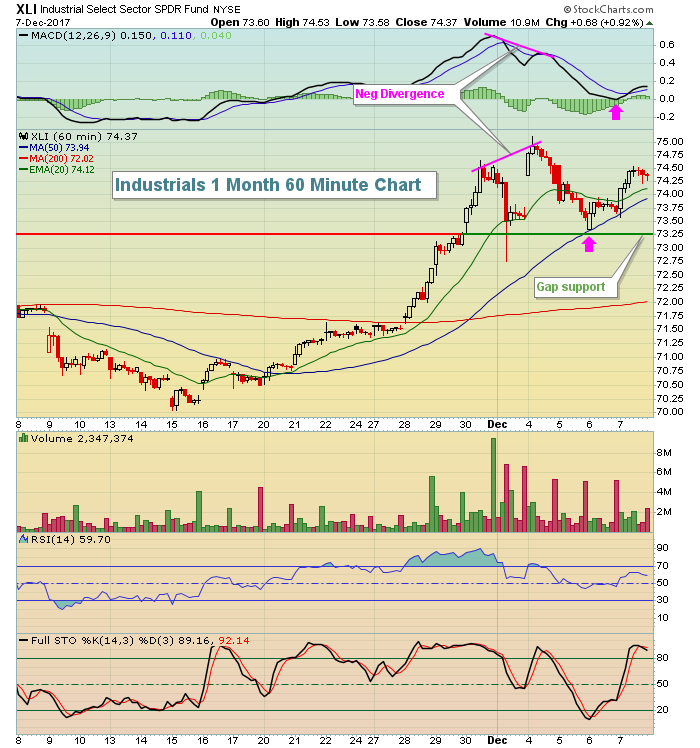 MACD divergences show us slowing price momentum on all time frames. But the length of time it takes to "play out" depends on the time frame chosen. For instance, a negative divergence on an hourly chart will "reset" much quicker typically than one on a daily chart, so it's a much better signal for very short-term traders and has little relevance to a longer-term trader or investor.
The recent intraday action in technology shows a much different picture:
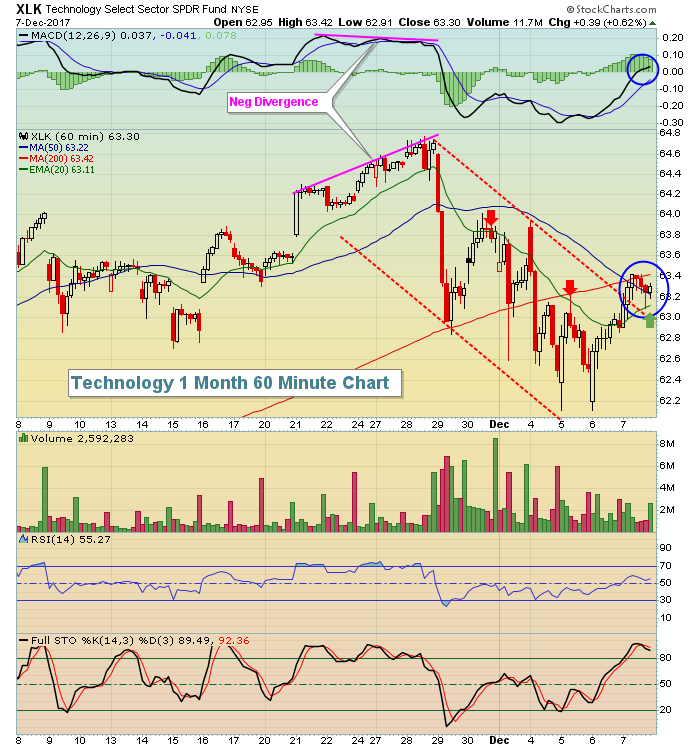 Yes, there was a negative divergence that began the selling, but this was not controlled selling. We saw much heavier selling in technology. In addition to the 60 minute negative divergence, the XLK also had a negative divergence on its daily chart. That's much more problematic in terms of momentum issues and the XLK has paid a steeper price for it. Note that during the downtrend, the declining 20 hour EMA was a big problem to clear. But now the XLK has made a reversal, cleared its downtrend channel and successfully tested its now-rising 20 hour EMA. Short-term, the picture has turned brighter for technology. Watch that 20 hour EMA, though, for clues of another possible downturn.
Pre-Market Action
A solid November jobs report (see details in Key Economic Reports section below) is boosting U.S. stock futures this morning while the treasury market has a somewhat muted response. The 10 year treasury yield ($TNX) hit 2.39% earlier this morning, but has backed off and now resides at 2.37%.
Global prices surged overnight in Asia and they're also higher this morning in Europe. Crude oil is higher by 1.6%. Dow Jones futures are up 65 points with a half hour left to the opening bell.
Current Outlook
Banks ($DJUSBK) should be in focus as we're just a couple of days away from another FOMC meeting. It's widely expected that the Fed will raise interest rates by a quarter point. But watch closely the wording they use as to unwinding their balance sheet. The Fed needs to sell a ton of treasuries and if the bond market begins to feel this selling could accelerate, we could see an acceleration of treasury selling. That would lift interest rates and, in turn, provide tailwinds to an already strong banking industry. Recently, we saw the DJUSBK print a negative divergence, but that has now been rectified with a 50 hour SMA test and a MACD centerline reset (pink arrows):
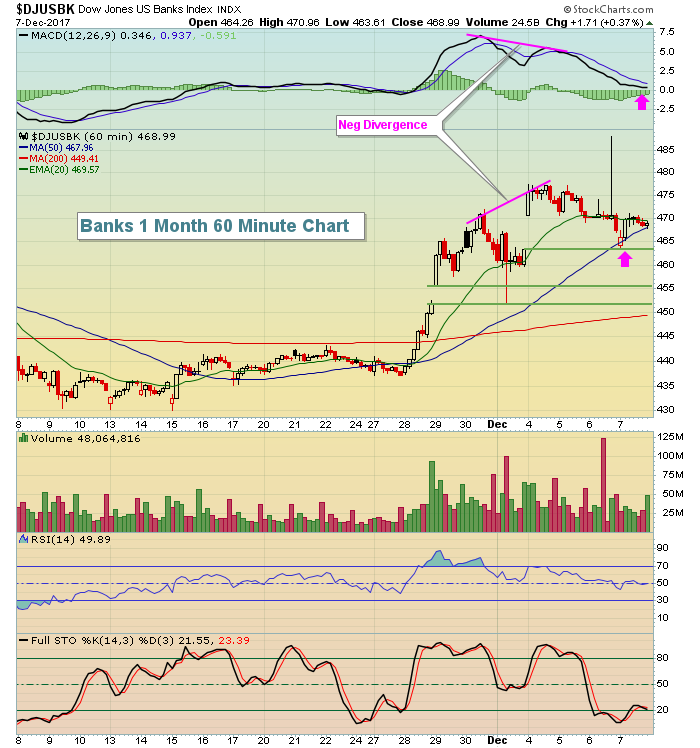 The three green horizontal lines represent various levels of gap support where I'd expect banks to find buyers during any upcoming period of weakness. We finished strong yesterday on the 10 year treasury yield ($TNX) and further strength today would likely be the catalyst for another run higher in banks.
Sector/Industry Watch
Healthcare (XLV) has been weak and we really don't need to look much further than pharmaceuticals ($DJUSPR) to understand why. The group has been under significant selling pressure since it printed a shooting star candle in October with very little relief. But the uptrend does remain in play and rotation back into healthcare stocks could provide an opportunity here:
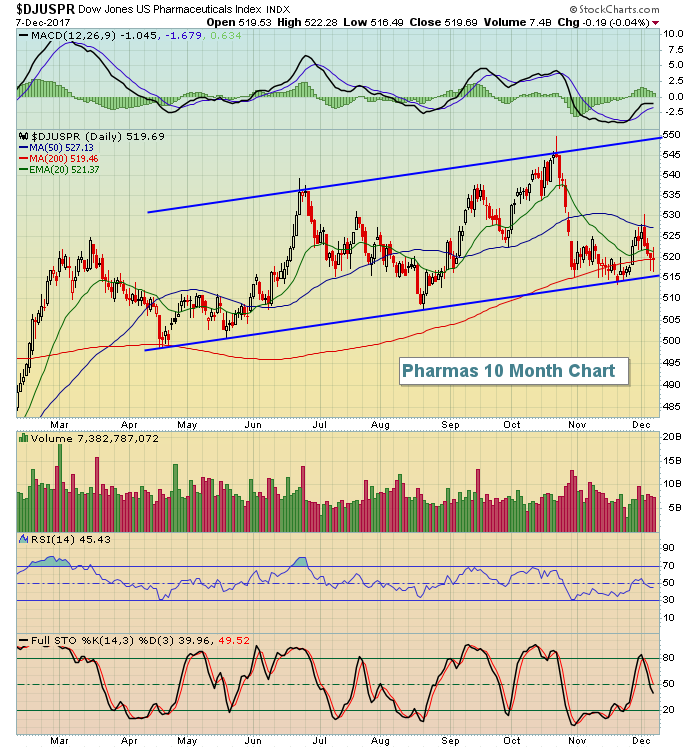 Volume has not been light on the selling over the past several weeks so respect price and trendline support near 515. If violated, the selling pressure could once again accelerate.
Historical Tendencies
December is a special month for small cap stocks (Russell 2000). Despite December being the best month for the benchmark S&P 500, the Russell 2000 ($RUT) has outperformed the S&P 500 by 1.4% on average over the past two decades. It's the widest outperformance of small caps vs. the SPX in any calendar month.
Key Earnings Reports
None
Key Economic Reports
November nonfarm payrolls released at 8:30am EST: 228,000 (actual) vs. 190,000 (estimate)
November private payrolls released at 8:30am EST: 221,000 (actual) vs. 184, 000 (estimate)
November unemployment rate released at 8:30am EST: 4.1% (actual) vs. 4.1% (estimate)
November average hourly earnings released at 8:30am EST: +0.2% (actual) vs. +0.3% (estimate)
December consumer sentiment to be released at 10:00am EST: 98.8 (estimate)
October wholesale trade to be released at 10:00am EST: -0.1% (estimate)
Happy trading!
Tom
