Market Recap for Monday, December 18, 2017
Rotation is powerful during bull markets and Monday's action was a perfect illustration. On November 15th, both the materials sector and small cap stocks were clear market laggards, but over the past 4-5 weeks we've seen both areas gather themselves and begin another push higher to help sustain this bull market advance. First, let's take a look at materials (XLB, +1.47%):
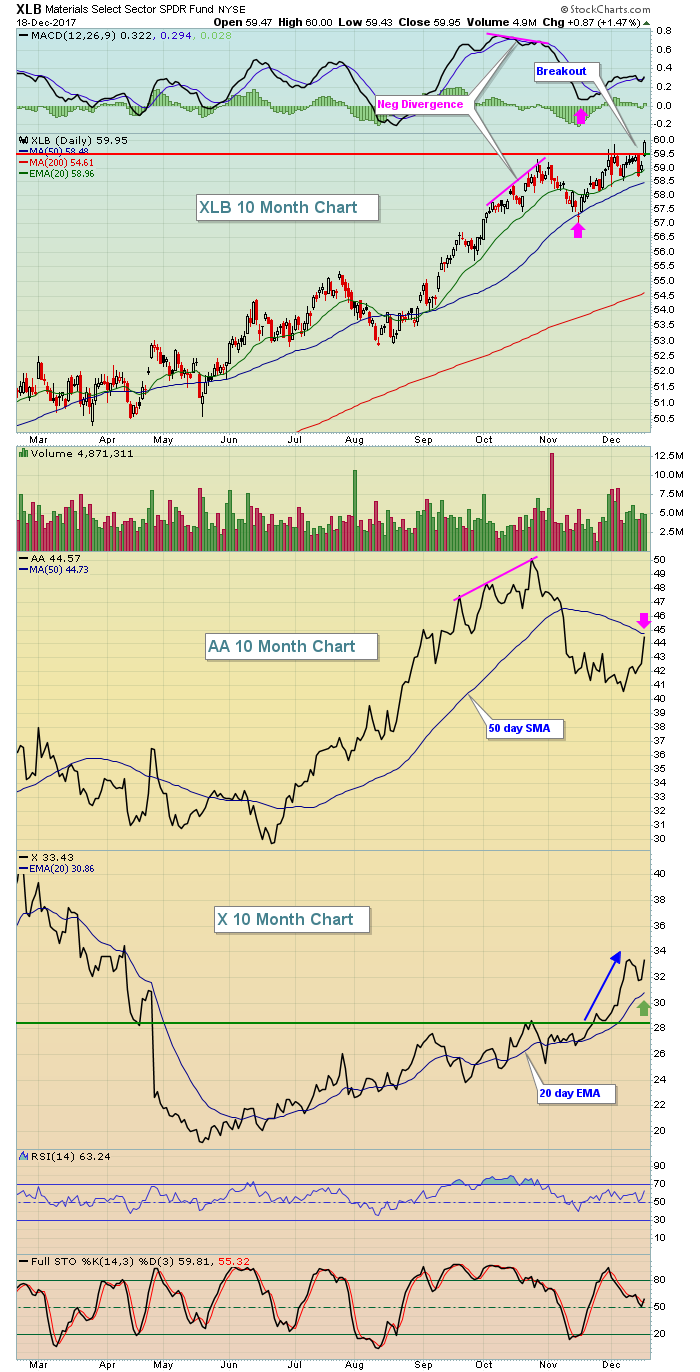 The XLB clearly had price momentum issues, as evidenced by the negative divergence that accompanied the late October price high. Subsequently, the XLB tumbled back to test its 50 day SMA and nearly reset its MACD at the centerline area (pink arrows on XLB portion of chart). Once that price momentum issue was resolved, however, money has rotated quickly back into materials and yesterday we saw a fresh new breakout. Great action. Leading the charge was Alcoa (AA) and USX (X) in the aluminum ($DJUSAL) and steel ($DJUSST) areas, respectively. Not shown in the above chart is the fact that AA had recently printed a negative divergence of its own on the late October high - quite similar to XLB's. The strength in AA shares yesterday enabled it to rise up to test its 50 day SMA. Now we'll see if it can break above that key moving average. USX, meanwhile, has slowly been strengthening and the past three weeks or so has seen the stock accelerate its advance, a bullish development. A green arrow highlights the rising 20 day EMA, where I'd look for support on any short-term profit taking. Finally, check out the seasonal strength in X, explained below in the Historical Tendencies section.
Small cap stocks once again showed relative strength. This is quite typical behavior during the second half of December. If you haven't already seen it, check out my ChartWatchers article from this past weekend where I provided stunning historical returns for small caps (Russell 2000) in the second half of December. While past results certainly provide us no guarantees as to future results, there's no denying the historical tendency of significant outperformance in the small cap arena this time of year. But we don't need to focus only on historical strength because the Russell 2000 broke out yesterday to an all-time high close:
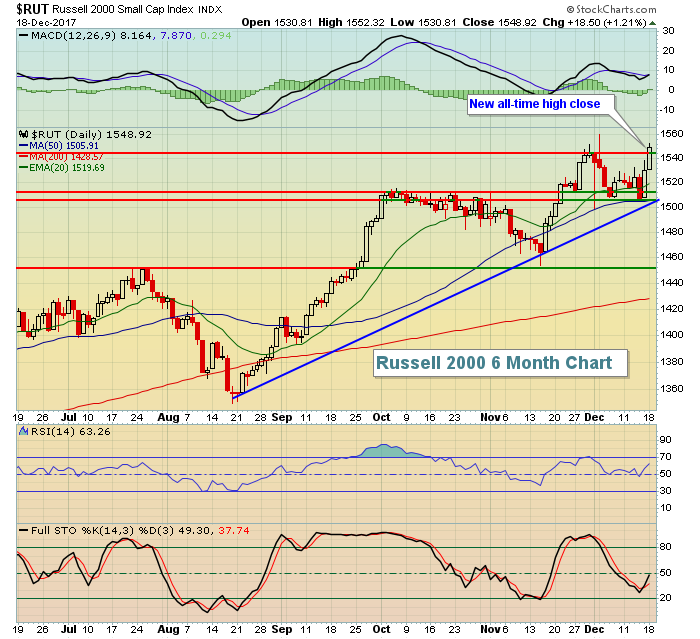 Note that the price low from Thursday's close intersects both trendline support and the 50 day SMA so I'd view the 1500-1505 area to be critical support. So long as the RUT continues to trade above this zone, I'd continue to expect bullish action and higher prices during the balance of December and into 2018.
Pre-Market Action
We're on Day 2 of a three day homebuilding "summit". Yesterday, we saw a very strong housing market index (74 actual reading vs 70 estimate). Today, as you can see below in the Economic Reports section, very strong housing starts and building permits were released. Tomorrow is Day 3, where we'll get the latest on existing home sales. After tomorrow, the economic agenda picks up into other areas of our economy.
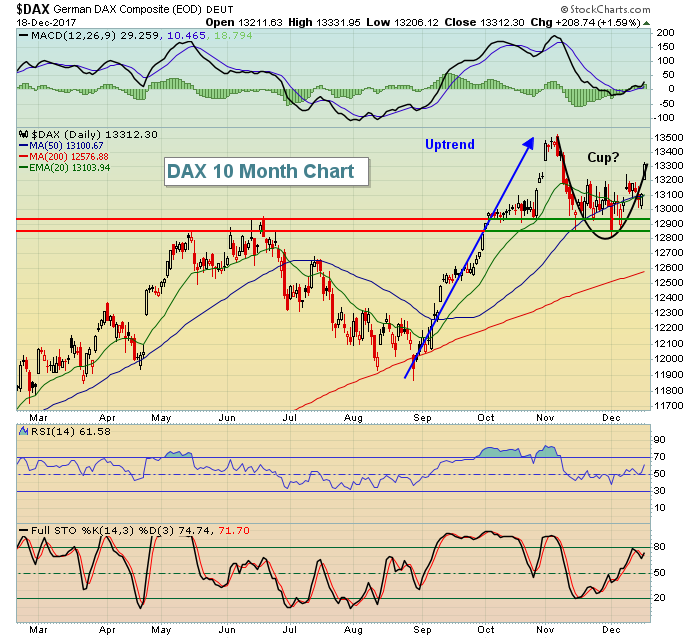
Asia was mostly higher overnight, although we did see a bit of profit taking on the Tokyo Nikkei ($NIKK). In Europe this morning, we're seeing mixed action, although the German DAX ($DAX) saw a bullish breakout yesterday and now appears to be forming the right side of a very bullish continuation pattern - the cup with handle:
 Bullish action continues globally and that's aiding the bull market here in the U.S. Dow Jones futures look to continue their torrid pace higher, up 70 points with a little more than 30 minutes left to the opening bell.
Current Outlook
Consumer staples (XLP, -0.05%) finished near its flat line yesterday, which on the surface may not appear to be a bad thing. But after a huge advance over the past six weeks, it printed a very ominous inverted hammer that could lead to at least a bit of short-term selling. Check it out:
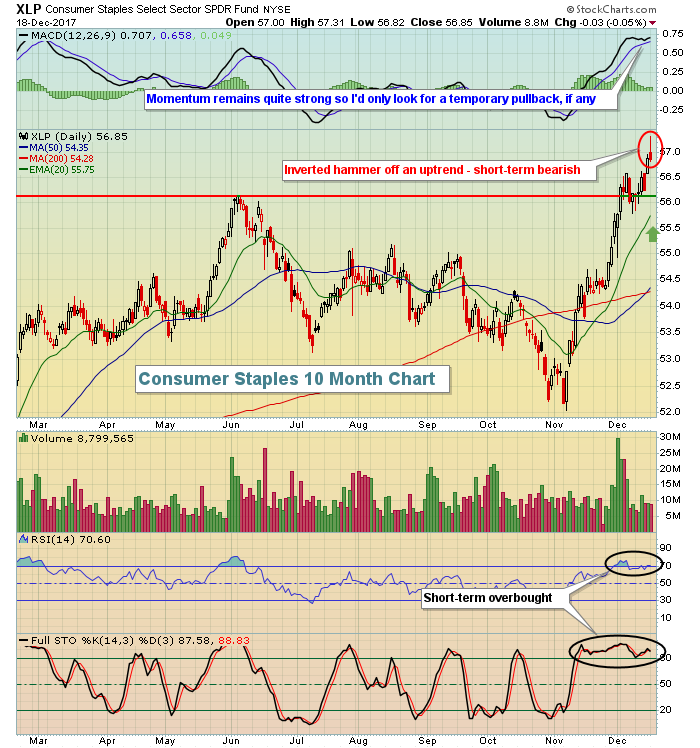 Keep in mind that this chart looks pretty solid technically so I'm not looking for a major top. Rather, we might see just a day or two of underperformance with a trip down to test the rising 20 day EMA to help relieve overbought momentum oscillators possibly in the works.
Sector/Industry Watch
Among the consumer staples industry groups, the Dow Jones U.S. Soft Drinks Index ($DJUSSD) left a long tail above price resistance yesterday and closed on its low of the session, printing a reversing dark cloud cover candle in the process. While I wouldn't use this short-term bearish candle as a reason to short the space - as I don't look to short anything in bull markets - I would use it to potentially lock in short-term profits in stocks within the group as I'd expect to see a pullback after yesterday's action. Here's the chart:
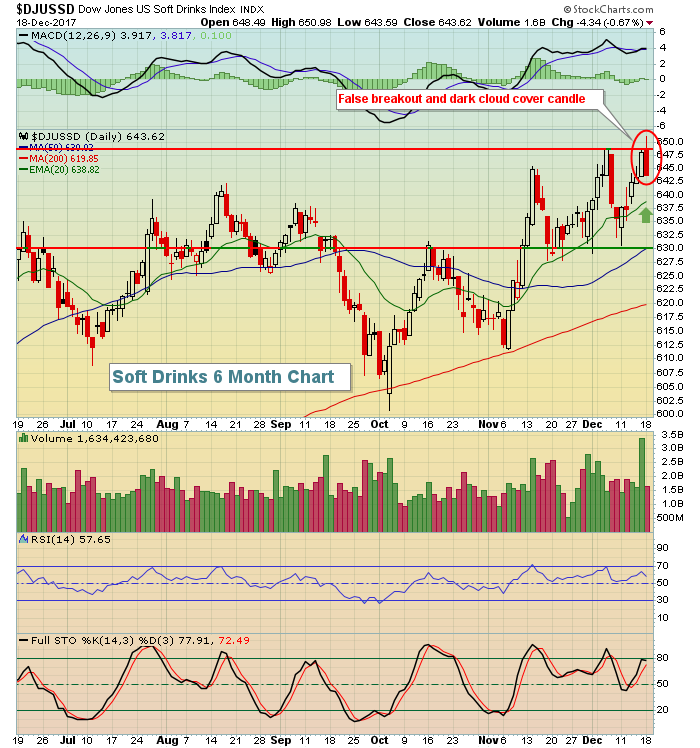 It's likely we'll see just a shallow pullback, perhaps down to test the rising 20 day EMA (green arrow). Should that support fail to hold, then the odds of a trip down to test both price support and the 50 day SMA in the 630 area would grow.
Historical Tendencies
The recent strength in USX (X) shouldn't be too surprising to fans of seasonality. Over the past 20 years, X has risen 65% of all Decembers and has produced average December returns of 9.7%. That's a solid annual return and yet X has managed to earn that return in December alone over the past two decades.
Key Earnings Reports
(actual vs. estimate):
CCL: vs .50
DRI: .73 vs .70
FDS: 2.04 vs 1.98
(reports after close, estimate provided):
FDX: 2.87
MU: 2.20
RHT: .70
Key Economic Reports
November housing starts released at 8:30am EST: 1,297,000 (actual) vs. 1,240,000 (estimate)
November building permits released at 8:30am EST: 1,298,000 (actual) vs. 1,270,000 (estimate)
Happy trading!
Tom
