Market Recap for Tuesday, January 23, 2018
The tech-laden NASDAQ powered forward to new all-time highs on Friday, closing above 7400 for a second consecutive session and now approaching 7500. All of our major indices ended higher, except for the Dow Jones, which saw a last minute bout of selling to finish 3 points lower. In an unusual twist, utilities (XLU) gained 0.96% to top the sector leaderboard. The XLU has bounced repeatedly in the 49.50-50.50 level, so Tuesday's strength shouldn't come as a big surprise to technicians.
Consumer discretionary (XLY, +0.84%) also had another very strong session with specialty retailers ($DJUSRS) getting a huge boost from another strong earnings report from Netflix (NFLX, +9.98%). Travel & tourism ($DJUSTT) was also strong with a multi-month breakout in priceline.com (PCLN) leading the charge there:
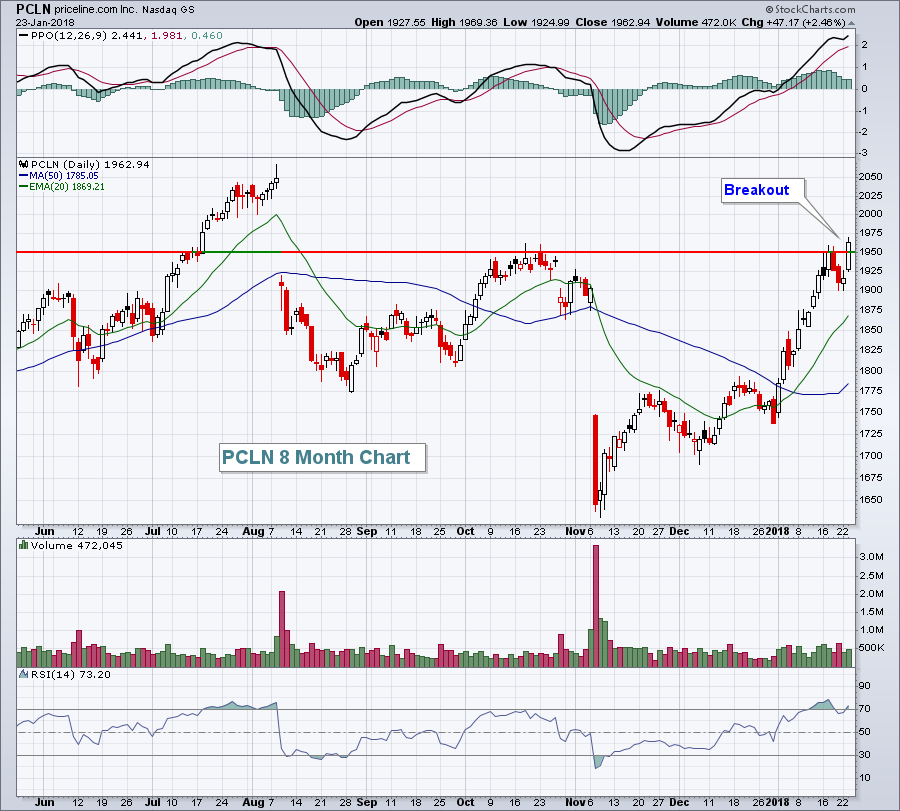 I've documented on many occasions that PCLN's seasonal chart is one of the most stunning. Over two decades, PCLN's average returns from January through April are as follows:
January: +5.8%
February: +8.8%
March: +7.8%
April: +13.2%
January 2018 is certainly off to a great start for this online giant.
Pre-Market Action
Gold is up above $1350 this morning, challenging the early September high. A breakout there would be quite significant, setting up a major test of multi-year price resistance closer to 1400. The 10 year treasury yield ($TNX) is up 3 basis points to the 2.66% level and acting though it is heading higher. Of course, higher yields mean a weaker bond market with more rotation to equities.
Asian markets were mixed overnight with mostly lower prices in Europe. Dow Jones futures, on the other hand, are showing strength once again, up 100 points with 45 minutes left to the opening bell.
Current Outlook
Excluding utilities (XLU), the "bargains" among sectors based strictly on weekly RSIs are consumer staples (XLP), energy (XLE) and healthcare (XLV). Their weekly RSIs are only in the mid-70s, still a ridiculously overbought level. The problem currently is that the market is pricing in significant economic strength ahead with historically low interest rates. That is lighting a fire under valuations and, quite honestly, I can't tell you where this current feverish rally ends. Bull market rallies can extend well beyond what any of us believe is reasonable. While on the surface it looks as though every area is overbought, that's not the case.
The key aggressive sectors have rallied in the neighborhood of 5-8% over the past 30 days. There are groups, however, that haven't participated to that degree. For instance, computer hardware ($DJUSCR) - home of Apple (AAPL) - is up a meager 2%. Furnishings ($DJUSFH) has a very nice long-term weekly chart, but is up just 1.5% during the past month. Pharmas ($DJUSPR) - threatening to make a major long-term breakout above 550 - is up a less robust 3%. Check out this weekly chart and the consolidation that's taken place over the past 2+ years:
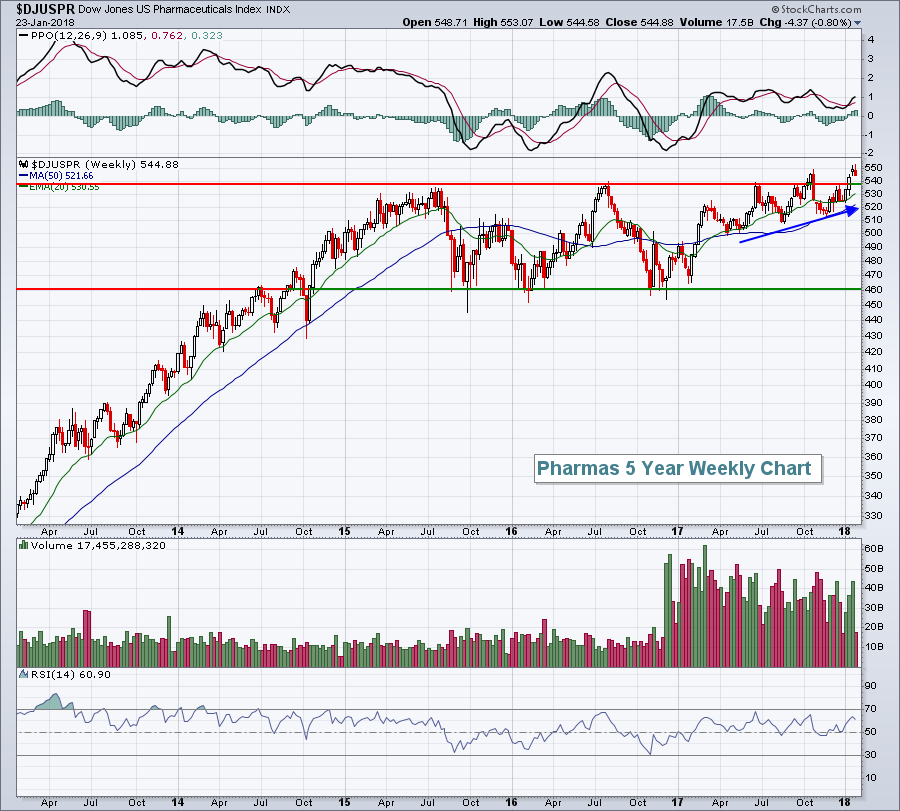 Despite yesterday's poor showing, I believe pharmas are in the very early stages of a solid upside move.
Sector/Industry Watch
I highlighted the pharma chart above, but continuing along those lines, check out the long-term weekly chart of healthcare (XLV):
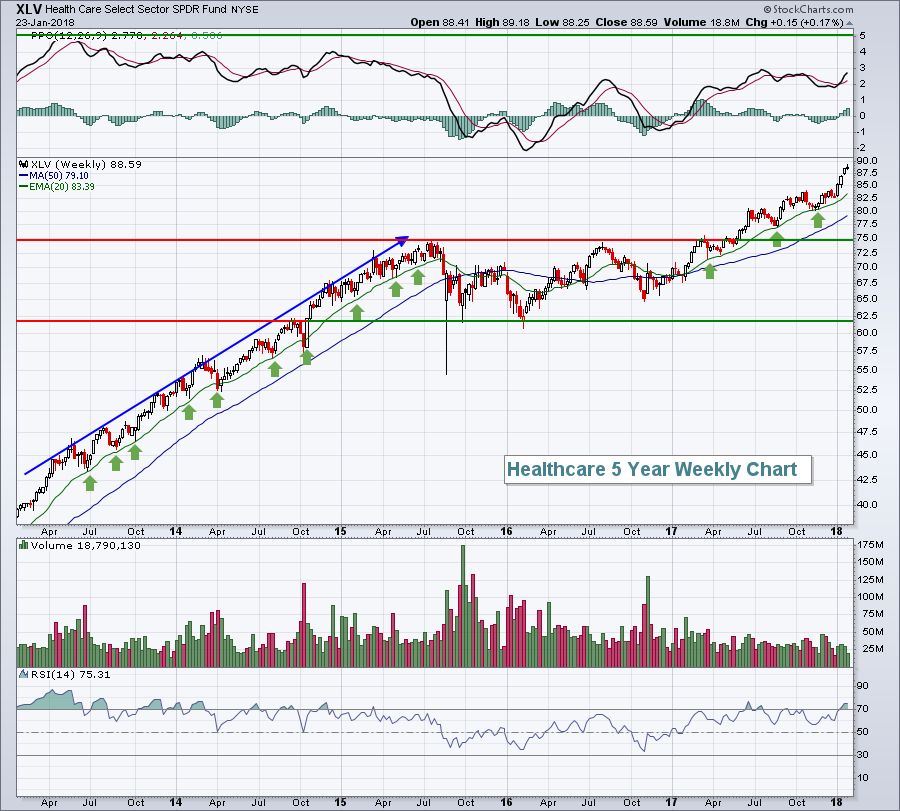 First, look at how healthcare performed earlier in this bull market - from 2013 through mid-2015. It was a long-term period of rising prices that held rising 20 week EMA support (green arrows) on every test with only two exceptions. Now fast forward to mid-2017. Do you see the same pattern? When a chart is trending higher, the 20 period EMA acts as fairly significant support on pullbacks. Keep that in mind for future high reward to low risk entry opportunities.
Historical Tendencies
The following represents the annualized return by calendar day on the S&P 500 since 1950:
January 24 (today): -13.27%
January 25 (Thursday): +8.67%
January 26 (Friday): +22.66%
January 29 (Monday): +34.02%
January 30 (Tuesday): +5.47%
January 31 (Wednesday): +78.73%
Key Earnings Reports
(actual vs. estimate):
ABT: .74 vs .73
BHGE: .15 vs .14
CMCSA: .49 vs .47
GD: 2.50 vs 2.37
GE: .27 vs .28
ITW: 1.70 vs 1.62
NSC: 1.69 vs 1.56
NTRS: 1.35 vs 1.30
NVS: 1.20 vs 1.16
ROK: 1.96 vs 1.74
SWK: 2.18 vs 2.14
TEL: 1.40 vs 1.25
UTX: 1.60 vs 1.56
(reports after close, estimate provided):
AMP: 3.09
CCI: 1.06
DFS: 1.53
F: .42
GWW: vs 2.18
LRCX: 3.69
LVS: .77
RJF: 1.43
URI: 3.34
XLNX: .63
Key Economic Reports
November FHFA house price index to be released at 9:00am EST: +0.5% (estimate)
January PMI composite flash to be released at 9:45am EST: 54.0 (estimate)
December existing home sales to be released at 10:00am EST: 5,750,000 (estimate)
Happy trading!
Tom
