Market Recap for Wednesday, February 7, 2018
With the exception of a fractional gain in the small cap Russell 2000, late day selling resulted in losses on each of our major indices. The Dow Jones spent much of the day in positive territory and sported a 270 point gain with less than a half hour to the close, but that's when we saw increased selling pressure right up to the closing bell. The NASDAQ 100 ($NDX) showed relative weakness on the day as many of its biggest components - AAPL (-2.14%), AMZN (-1.81%), FB (-2.77%), GOOGL (-2.68%) and MSFT (-1.88%) - finished in negative territory, leading to underperformance in technology (XLK, -1.28%).
Energy (XLE, -1.67%), which has no representation in the NASDAQ 100, was the only sector to perform worse than technology. The XLE has been the worst performing sector for the last week and the last month, dropping more than 8% over both periods. The culprit? Crude oil prices ($WTIC). While we haven't seen a major technical breakdown in the WTIC, it's beginning to threaten some key technical levels. Let's start with the daily chart:
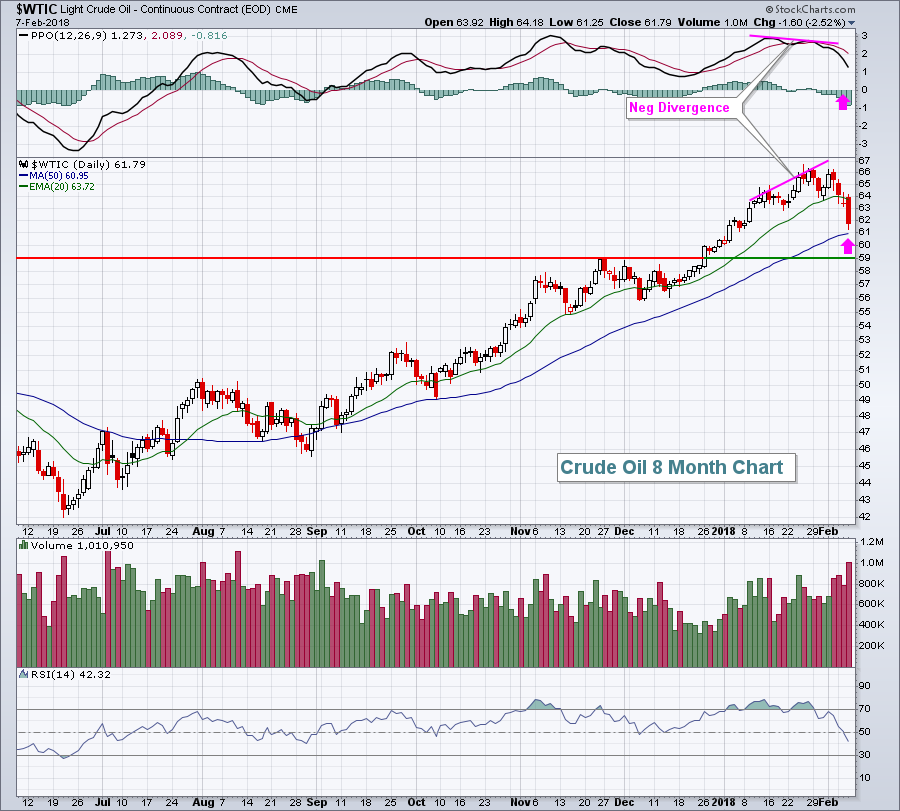 Negative divergences suggest slowing price momentum and, typically, we see deeper selling to at least 50 day SMAs after such divergences print. There's still solid price support at 59.00 per barrel. On the weekly chart, this 59.00 level becomes even more pronounced:
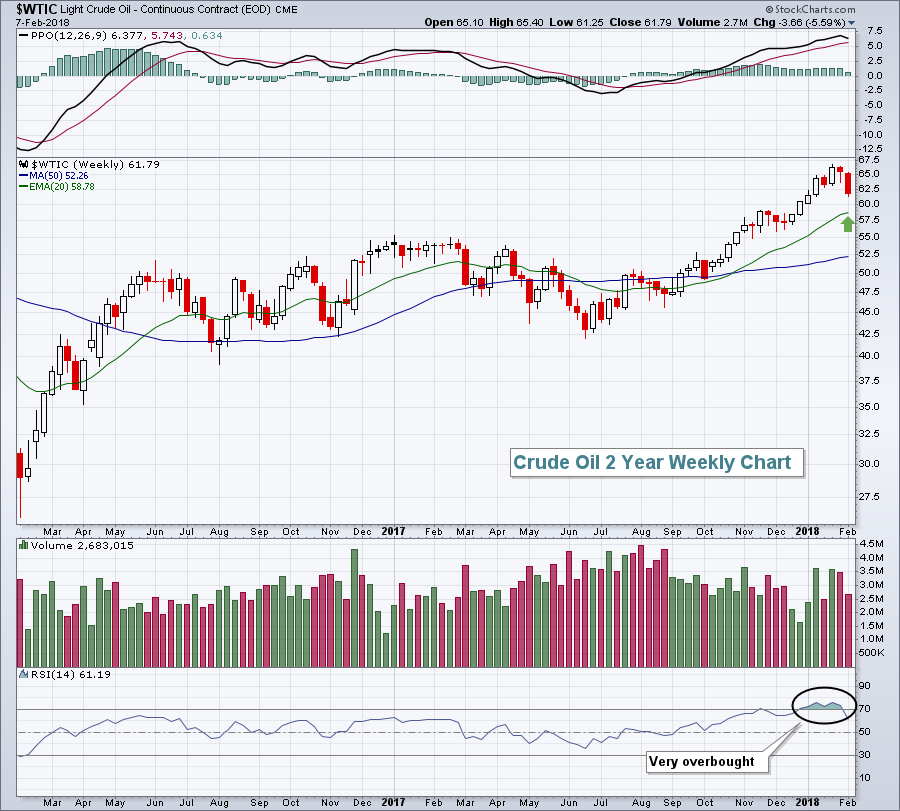 Price momentum on the weekly chart is bulllish and accelerating as evidenced by the strengthening PPO. During a period of accelerating price action, dips back to test the rising 20 period EMA are generally successful. The 20 week EMA is at 58.78 and rising. This provides further support near that 59 price support identified on the daily chart.
Industrials (XLI, +0.18%) was the best performing sector with defense ($DJUSDN) and aerospace ($DJUSAS) stocks leading the charge.
Pre-Market Action
The 10 year treasury yield ($TNX) is up nearly 3 basis points to 2.86% as selling in the bond market threatens to send the TNX to another 3 1/2 year high as we move closer and closer to 3.00%. Crude oil prices ($WTIC) remain under pressure, dropping close to 1% this morning to 61.23 per barrel.
There was mixed action overnight in Asia, while European markets are mostly lower. Despite the mixed action globally, Dow Jones futures are currently higher by 100 points as we approach the start of a new trading day.
Twitter (TWTR) is soaring in pre-market action after reporting its first-ever profitable quarter.
Current Outlook
The accelerating strength in the S&P 500 for the 10 weeks ending in late-January couldn't go on forever, but I doubt too many expected a 10% correction and a return of all those profits in one week. Unfortunately, that's how the stock market works. Losses occur very quickly while it takes much, much longer to accumulate those gains. The following is a perfect illustration of what can happen when the Volatility Index ($VIX) starts to rise and then breaks out:
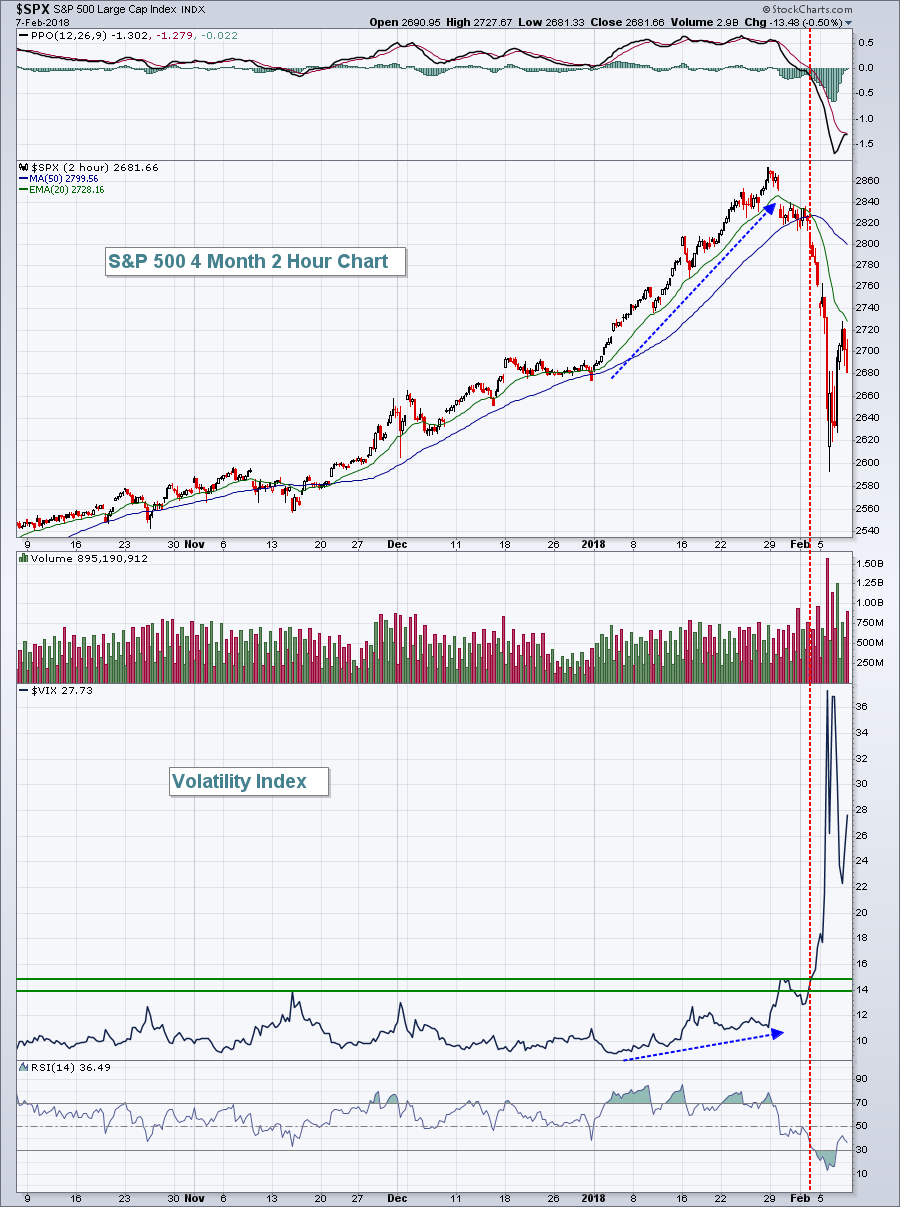 I try to learn something from major market swings like the one we're enduring and if there's one warning sign that could have alerted us to the selling we just saw, it's likely the fact that the VIX was rising in January while the S&P 500 was climbing higher nearly every day (blue-dotted directional lines). Rising equity prices tend to coincide with a falling VIX. The rising VIX was a signal that the market was nervous. As key support levels and moving averages were lost, the higher VIX readings (and heightened nervousness) kicked in and sellers gained total control of the action. Buyers left the building.
The stock market is a constant educational platform. Just when you think you know it all, you're thrown a curveball. We need to learn to hit the curveballs too.
Sector/Industry Watch
Of all commodities, I tend to pay closest attention to copper ($COPPER). The direction of copper prices tends to be highly and positively correlated to the direction of the benchmark S&P 500, much moreso than say gold ($GOLD) or silver ($SILVER). Here's a 20 year chart of copper with its S&P 500 correlation in the bottom indicator window:
 The good news here is that copper prices are trending higher along with the bull market rally in U.S. equities. After trending in a down channel below its 20 month EMA for a number of years, copper prices are now rising and are comfortably above its 20 month EMA. So long as this relationship continues, it points to a continuing bull market for equities.
Historical Tendencies
Freeport McMoran (FCX), a stock whose fortunes are tied to copper, has averaged gaining 18.6% per year over the past two decades. Roughly 75% of those gains, however, have occurred during the months of February (+4.7%), March (+6.2%) and April (+3.8%), which boast stellar average monthly gains. It would appear that as long as copper prices remain in their uptrend, FCX will be a primary beneficiary.
Key Earnings Reports
(actual vs. estimate):
ABB: .33 vs .25
ALXN: 1.48 vs 1.28
CVS: 1.92 vs 1.89
K: .96 vs .96
PM: 1.31 vs 1.36
REGN: 5.23 vs 4.68
TMUS: .48 vs .37
TOT: 1.10 vs 1.06
TSN: 1.81 vs 1.51
TU: .43 vs .45
TWTR: .19 vs .14
YUM: .96 vs .80
(reports after close, estimate provided):
AIG: .78
ATVI: .94
DXC: 1.99
EXPE: 1.16
FTV: .78
NVDA: 1.16
VRSN: .97
Key Economic Reports
Initial jobless claims released at 8:30am EST: 221,000 (actual) vs. 235,000 (estimate)
Happy trading!
Tom
