Market Recap for Tuesday, February 6, 2018
Volatility is the name of the game right now and big swings - both up and down - should be expected in the near-term. Yesterday was the bulls' turn as our major indices rallied back, led by the Dow Jones' 567 point gain. There was early selling to add on to the Monday afternoon swoon and the Volatility Index ($VIX) forged to an intraday high well into the 40s, a historical level where we've seen major S&P 500 bottoms print. Therefore, I believe the S&P 500 trading range has now been established. Here it is:
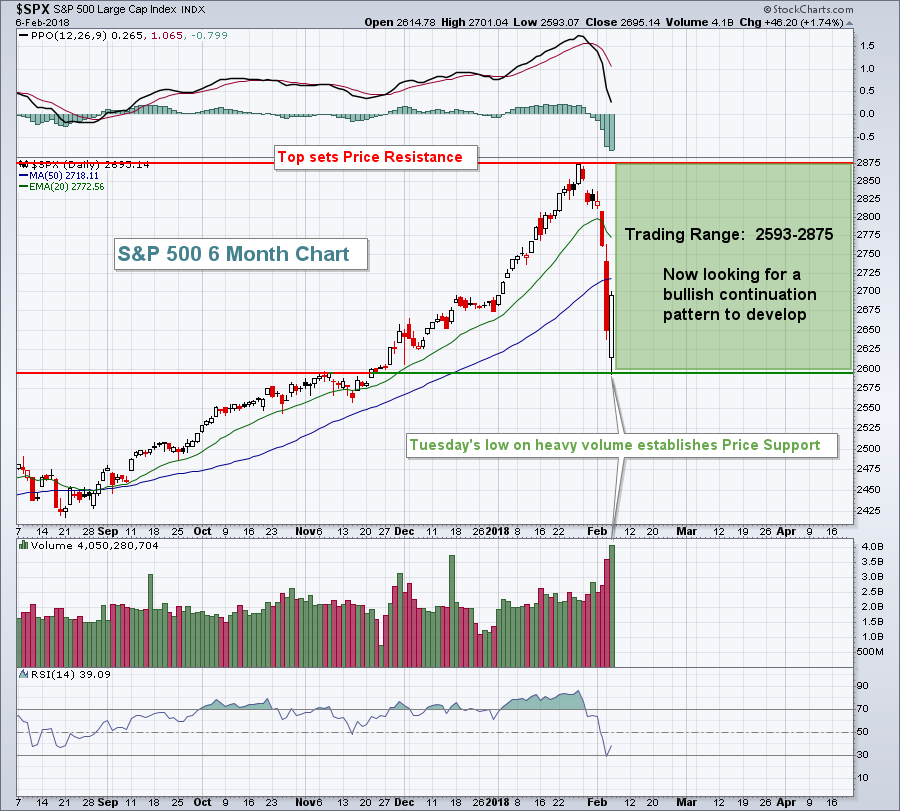 Trips to 40-50 in the VIX tend to mark very significant bottoms. Also, the volume on yesterday's reversal was of a capitulatory nature - over 4 billion shares, easily the highest level on the chart above. It's noteworthy that it was even more than the two quad-witching options expiration days on the 3rd Fridays in September and December.
Eight of nine sectors advanced with the leader being materials (XLB, +3.27%), followed by technology (XLK, +2.87%) and consumer discretionary (XLY, +2.56%). The only sector to fall was the defensive-oriented utilities sector (XLU, -1.49%), which sold off despite lower treasury yields.
*****Quick Reminder****
You can subscribe for FREE to my blog by scrolling down to the bottom of this article, typing in your email address and clicking the green "Subscribe" button. Once you've subscribed, my blog articles will be sent to your email address immediately upon being published. Thanks for your support, it's much appreciated! Also, feel free to send me comments about my blog at "tomb@stockcharts.com". I'd love to hear from you!
Pre-Market Action
We've seen another morning of swings in futures, but not nearly as crazy as Tuesday morning. Asian markets were mixed overnight, while European markets are mostly higher as investors across the globe take a collective deep breath.
Both crude oil ($WTIC) and gold ($GOLD) are down fractionally, while the 10 year treasury yield ($TNX) is up slightly, nearing 2.80% once again.
With still plenty of time to the opening bell on Wall Street, Dow Jones futures are down nearly 100 points.
Current Outlook
One of the pillars of a bull market is traders' appetite for risk. Put another way, we need to see relative strength in aggressive areas of the market. The U.S. stock market, and global markets for that matter, were due for a correction. We've now witnessed one, which is a positive development for equities. The technical alignment amongst the sectors couldn't be any stronger really, so I look for the bull market to continue, albeit in a more consolidatory fashion now that highs and lows have been established.
Check out the relative strength of our aggressive sectors over the past year:
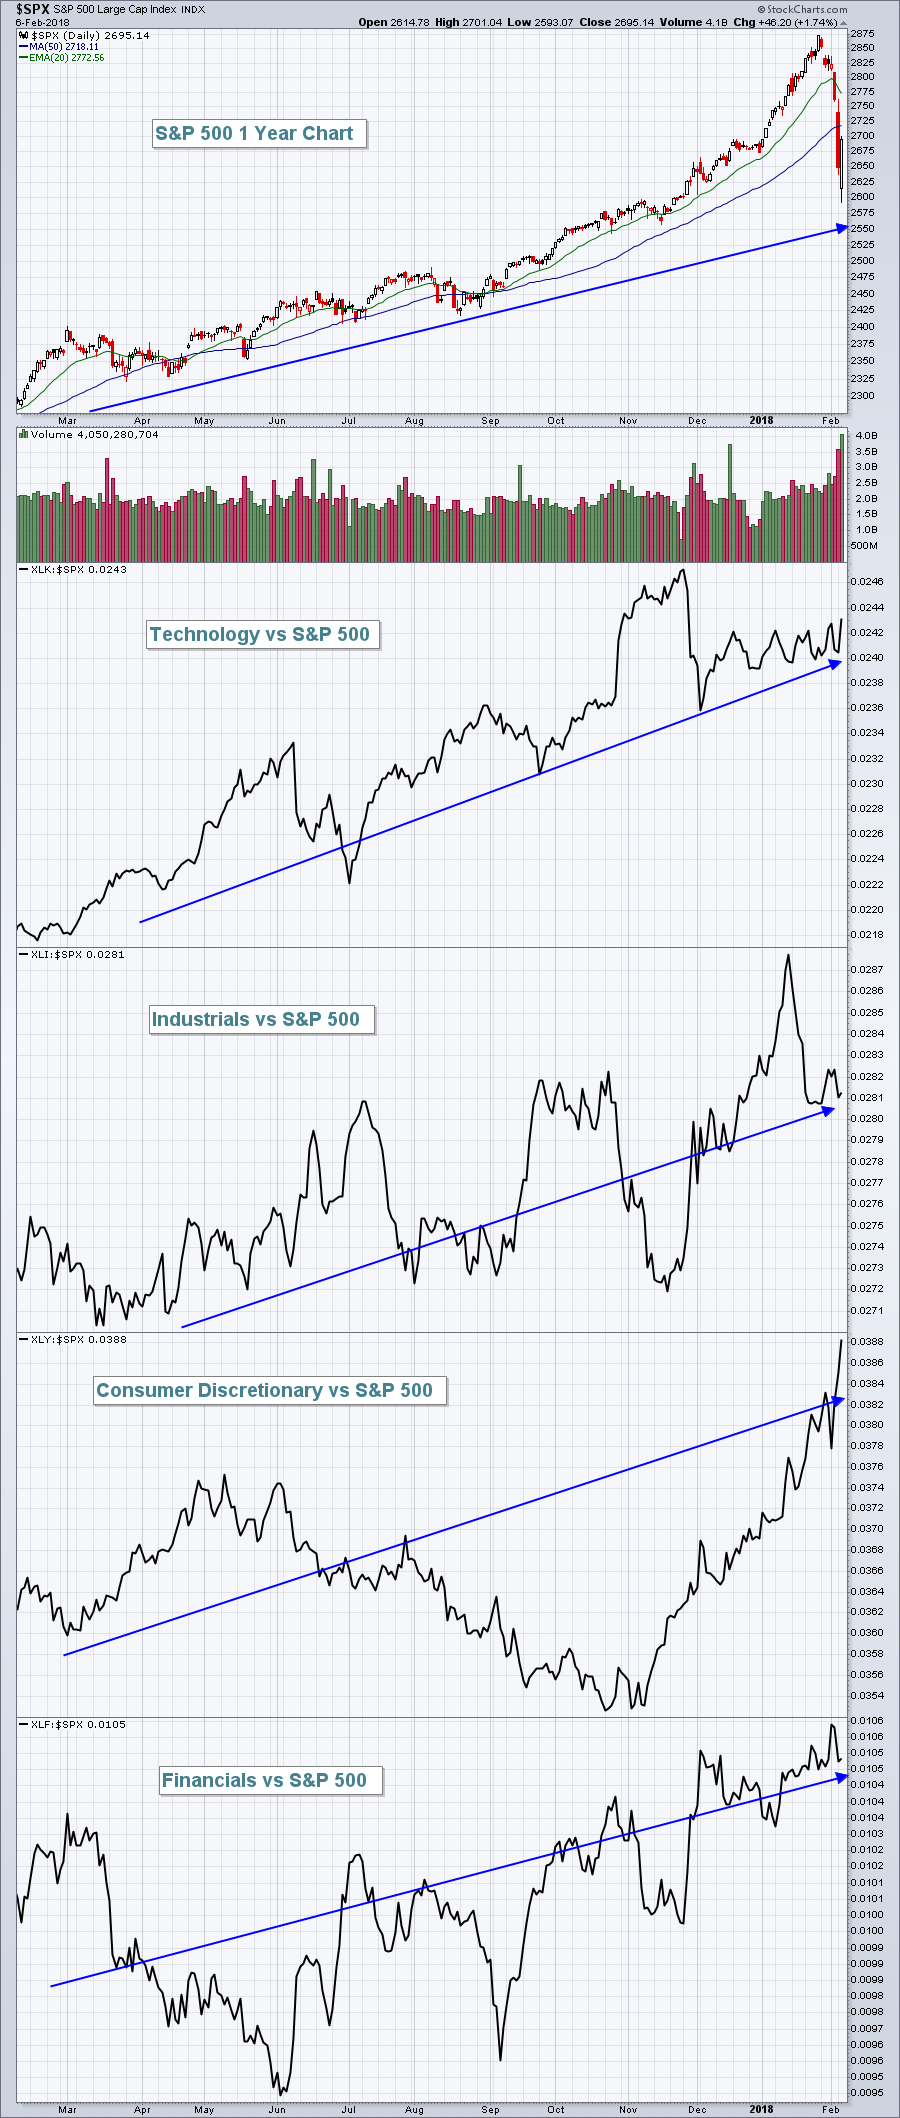 This chart remains quite bullish in my view and is a critical "under the surface" signal. This doesn't mean we'll see a market that moves straight up from here. We could see more violent swings as the VIX remains at 30, still an elevated level. But I'll be surprised if Tuesday morning's low at 2593 is violated as it occurred during panicked selling on extremely heavy volume and Tuesday's action overall to me feels like a day of capitulatory action.
Sector/Industry Watch
General Motors (GM) reported its latest quarterly earnings and that very solid report appeared to save the day for autos ($DJUSAU). A bullish engulfing candle formed on the group that likely marks a bottom on the daily chart:
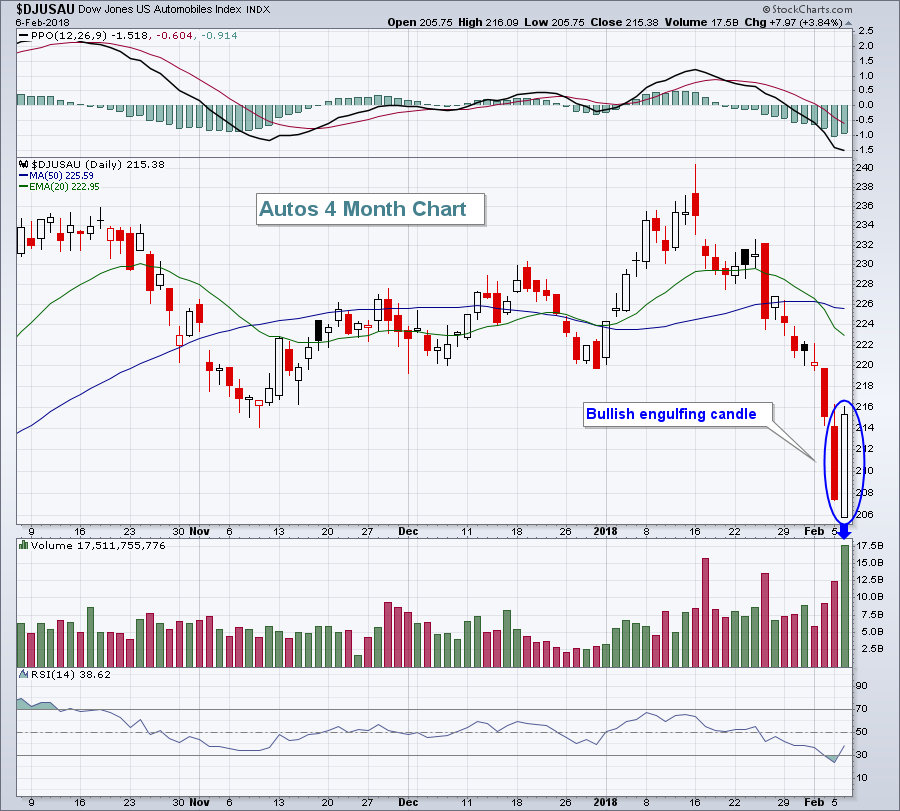 Check out the volume on the buying. If that's not enough technical evidence of a potential bottom, then let's look at a weekly chart:
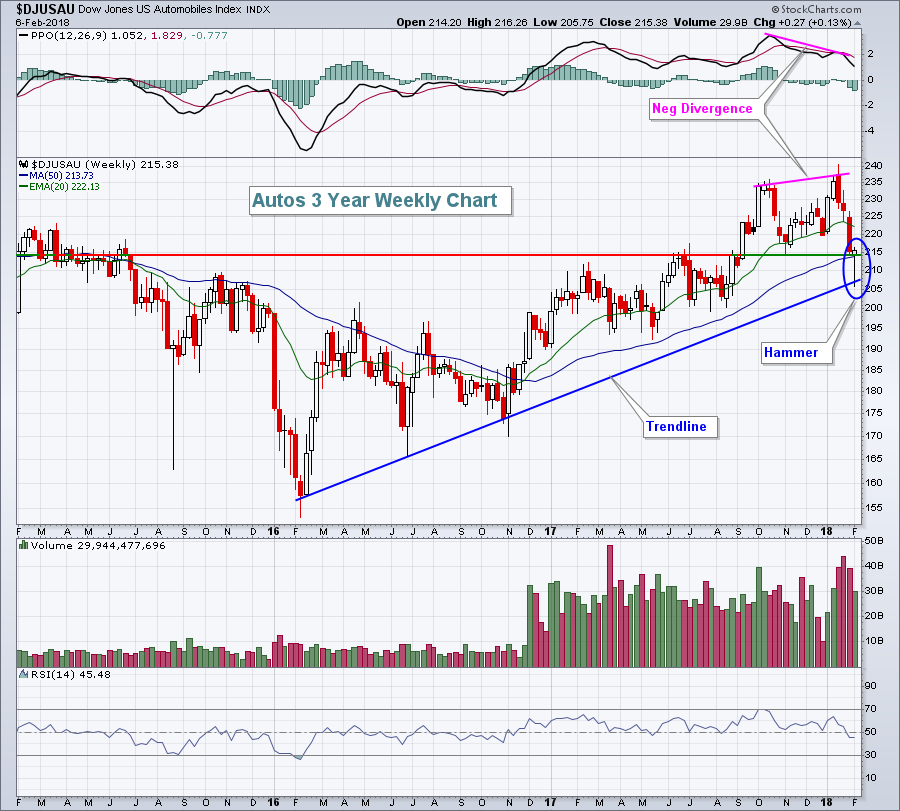 Autos have tested long-term trendline support and bounced nicely. There was a weekly negative divergence that required consolidation or selling and we've now seen that. The current hammer suggests the uptrend remains in play and I'd expect further strength in the weeks ahead. Of course, that current weekly candle won't be final until Friday's close and we could see a much different picture by then. However, with the VIX already hitting a critical area in the 40s, I believe the worst is over in terms of volatility spikes.
Historical Tendencies
We are now in the seasonal sweet spot for the Dow Jones U.S. Toys Index ($DJUSTY). February and March have produced average monthly gains of 3.2% and 3.7%, respectively, over the past 19 years. May (+3.4%) is the only other calendar month that produces average gains above 3%. Hasbro (HAS) is a particularly strong stock over the next few months seasonally.
Key Earnings Reports
(actual vs. estimate):
CTSH: 1.03 vs .97
EXC: .55 vs .62
GGP: .48 vs .47
HUM: 2.06 vs 2.00
ICE: .73 vs .72
SNY: .62 vs .69
STO: .39 vs .34
XEL: .42 vs .43
(reports after close, estimate provided):
ALL: 1.50
FISV: 1.37
FOXA: .36
MFC: .47
NTES: 2.11
NXPI: 1.82
ORLY: 2.78
PRU: 2.60
SU: .55
TSLA: (3.19)
TTWO: 1.00
Key Economic Reports
None
Happy trading!
Tom
