Market Recap for Tuesday, February 13, 2018
The U.S. stock market settled down on Tuesday, trading in a much narrower range, and finished with gains across its major indices for the third consecutive day. While it was good to see the market stabilize after such panicked selling, there remains critical overhead resistance that must be negotiated before a more meaningful rally can occur. Let's look at the S&P 500, for instance:
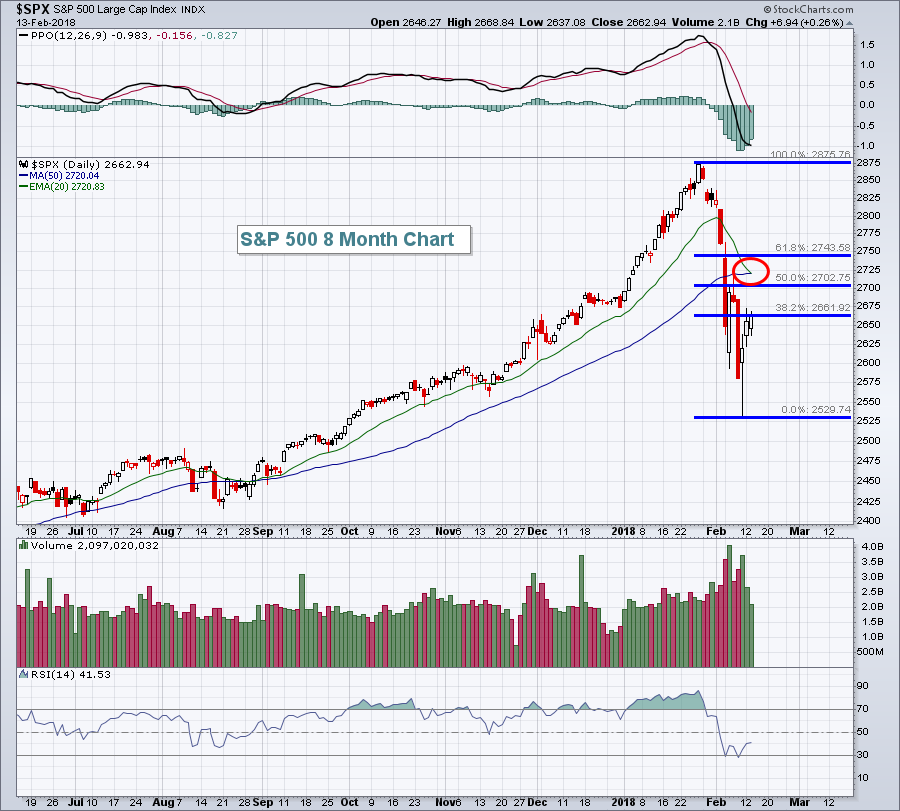 The rally the past two sessions has enabled the S&P 500 to test its first key Fibonacci retracement level (38.2%) at 2661. Note that the next two Fibonacci levels are at 2702 (50%) and 2743 (61.8%). In between both of those levels are the 20 and 50 day moving averages, both at 2720. Throw in major gap resistance at 2741 and I believe it becomes clear that the next 3-4% of gains on the benchmark S&P 500 will not be nearly as easy as the recent 5% rally off the bottom.
The Russell 2000's recent decline has left that index testing fairly significant price support near 1440-1450:
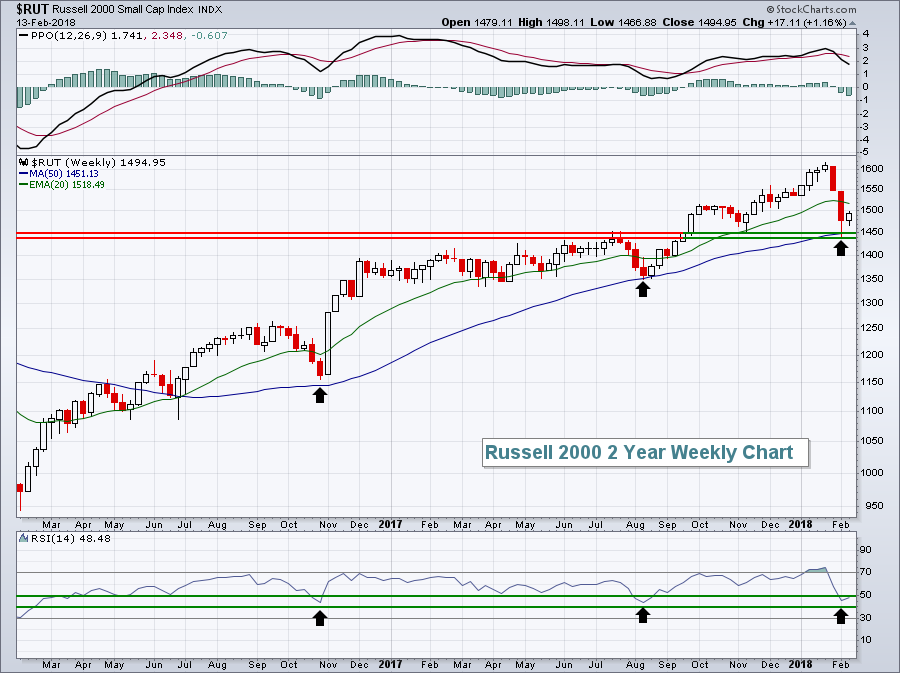 The black arrows show that weekly RSI readings in the 40s have marked significant bottoms in the Russell 2000 throughout this uptrend. There's also key support in the 1440-1450 area. Check out the discussion on the U.S. treasury yields and dollar below and quite a case can be made to be long small cap stocks at this level.
Consumer stocks led Tuesday's advance as consumer discretionary (XLY, +0.52%) and consumer staples (XLP, +0.46%) finished 1-2 on the sector leaderboard. Clothing & accesories ($DJUSCF) and broadline retailers ($DJUSRB) flexed their muscles again yesterday. Both of these industry groups have been among the hottest in discretionary and, on a relative basis, the money has been rotating towards discretionary stocks for months.
Pre-Market Action
With an hour left to the opening bell, Dow Jones futures were higher by more than 100 points as Wall Street was looking for a fourth consecutive day of gains. But......inflation data hit the wires at 8:30am EST and the report reflected an acceleration in inflation. Futures very quickly retreated several hundred points and the U.S. market now appears to be heading for a very weak open. In Asia overnight, the Hang Seng Index ($HSI) leapt nearly 700 points, or 2.27%. We're currently seeing across-the-board strength in Europe as well as global markets look to contain the selling from the past two weeks.
Tonight after the bell, two tech giants - Cisco Systems (CSCO) and Applied Materials (AMAT) - report their latest quarterly results.
Current Outlook
Below in the Sector/Industry Watch section, I've made a technical argument for the dollar to resume the upward trend that was established from 2011 through late-2016. If the dollar does in fact rise again, the small cap Russell 2000 index ($RUT) would likely feel a significant tailwind. In the chart below, I'm highlighting the difference between the 10 year treasury yield ($UST10Y) here in the U.S. and that of Germany ($DET10Y) and how that correlates to the U.S. Dollar ($USD):
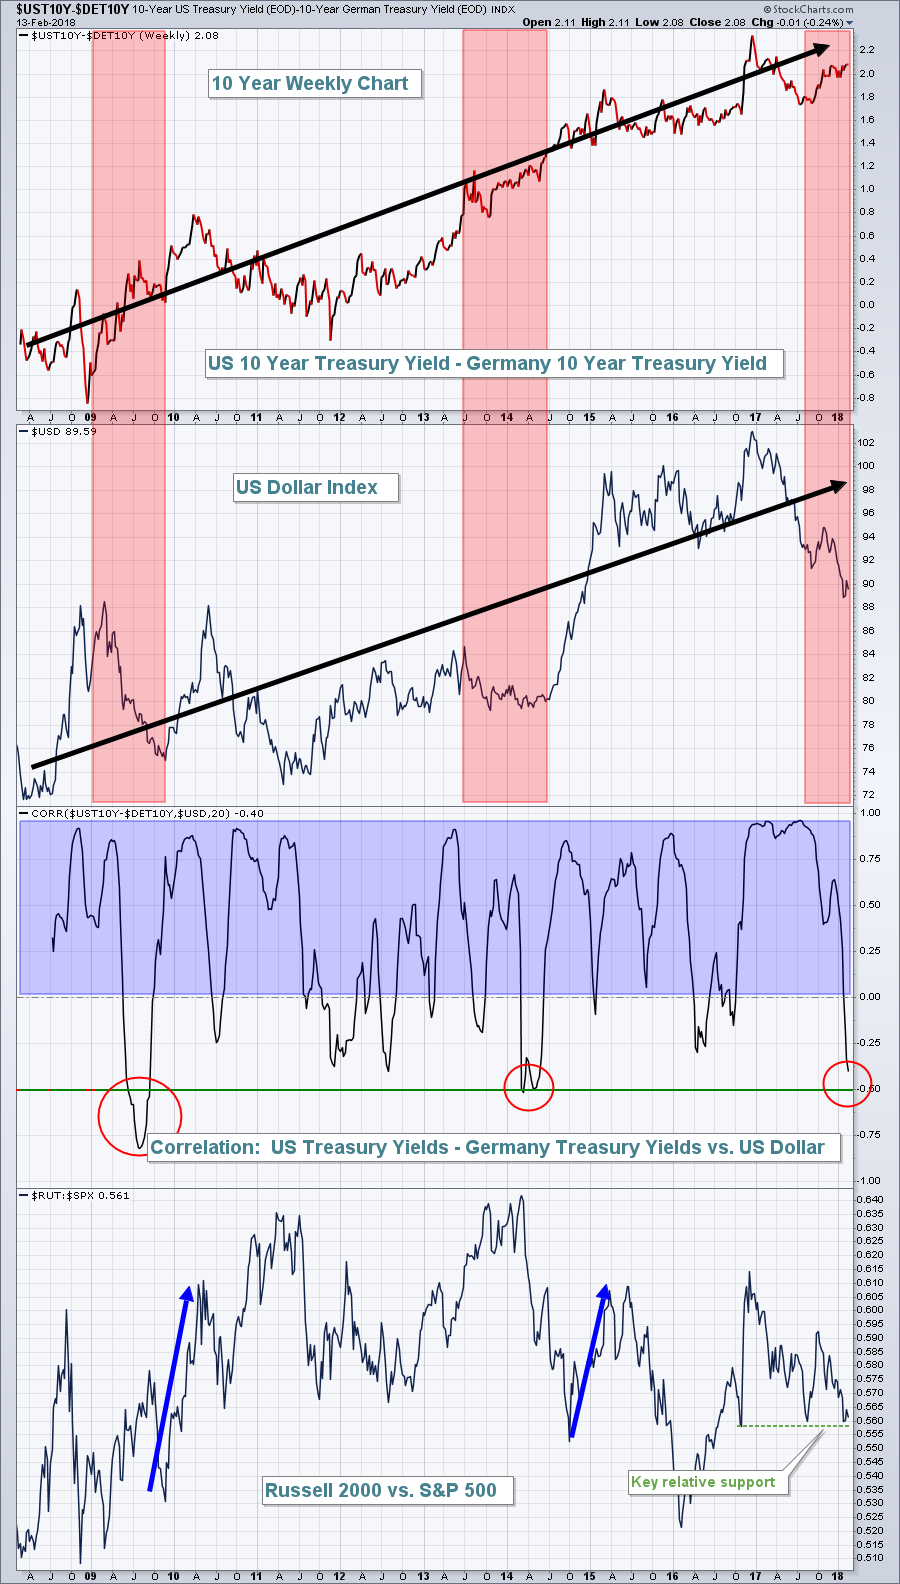 I read an article by John Murphy months ago that discussed the change in U.S treasury yields vs. foreign treasury yields and how that difference impacts the dollar's direction. The above chart highlights the difference between the US 10 year treasury yield and Germany's 10 year treasury yield and the chart just beneath it shows the US dollar. The very thick black directional lines show the relationship, as does the correlation indicator in the window just beneath these two charts. The blue shaded area on the correlation indicator tells us that the dollar is very positively correlated to the direction of the difference between US treasury yields and those in Germany. It's now perfect correlation, however, and what happens during the periods of negative divergence is what's intriguing to me.
The red shaded areas above highlight the negative correlation that occasionally occurs. In the two prior occurrences in 2009 and 2014, the dollar quickly reversed its downward course and rallied back in sync with the difference in treasury yields. During those two periods of rapidly-rising levels in the dollar, take a look at how the Russell 2000 completely dominates the benchmark S&P 500 (thick blue directional lines). A rapidly increasing dollar has negative consequences for large multinational companies that must translate foreign profits into more expensive dollars. Hence, those larger companies will underperform. That can set up a perfect storm for small caps whose businesses are almost exclusively in the U.S. and require no currency translation.
So it's very important to watch the dollar index at 89 support. If that technical level holds and the dollar begins to play "catch up" with the rising "$UST10Y-$DET10Y", look for small caps to outperform. As noted in the Market Recap section above, the Russell 2000 is close to significant price support so outweighing that group might make good sense depending on your own investment strategy and risk tolerance.
Sector/Industry Watch
The U.S. Dollar Index ($USD) struggled mightily on Tuesday and it's at a very critical juncture in my view. The USD is now testing very significant price and trendline support after an ugly 15 month decline:
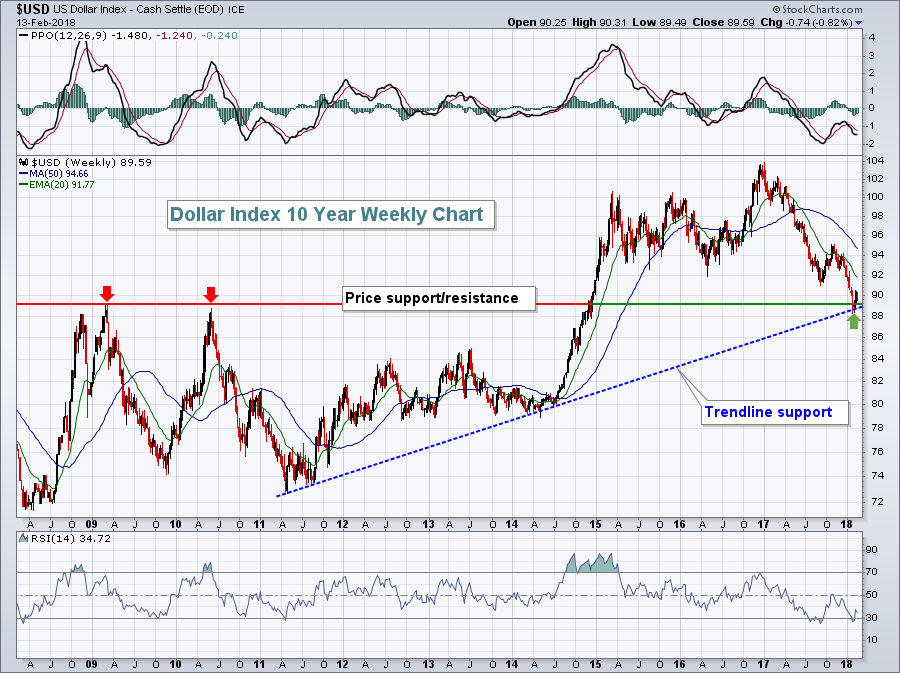 What happens in one currency or asset class has repurcussions in others. The falling dollar has enabled large, multinational companies here in the U.S. to easily outperform smaller companies that do most, if not all, of their business domestically. If the dollar is to make a sharp turn higher, the 89 area would appear to be a likely level technically.
Historical Tendencies
Given that it's February 14th, why not check out the seasonal tendency for Hershey Foods Corp (HSY)? You might be surprised by the February pattern. Over the past 20 years, HSY has risen 90% of Februarys and has averaged gaining 3.7% during the month. The calendar months around February are not that bullish. So is the February strength a coincidence? Or is the strength truly related to the Valentine's Day psychology and buying of chocolate?
Key Earnings Reports
(actual vs. estimate):
DPS: vs 1.17 (awaiting results)
HLT: .54 vs .44
IQV: 1.40 vs 1.34
SHPG: vs 3.86 (awaiting results)
TAP: .62 vs .56
(reports after close, estimate provided):
A: .58
AMAT: .97
CSCO: .59
EQIX: 4.80
MAR: 1.00
NTAP: .90
SLF: .83
WMB: .20
WPZ: .44
Key Economic Reports
January CPI released at 8:30am EST: +0.5% (actual) vs. +0.3% (estimate)
January Core CPI released at 8:30am EST: +0.3% (actual) vs. +0.2% (estimate)
January retail sales released at 8:30am EST: -0.3% (actual) vs. +0.3% (estimate)
January retail sales less autos released at 8:30am EST: -0.2% (actual) vs. +0.5% (estimate)
December business inventories to be released at 10:00am EST: +0.3% (estimate)
Happy Valentine's Day and happy trading!
Tom
