Market Recap for Thursday, March 15, 2018
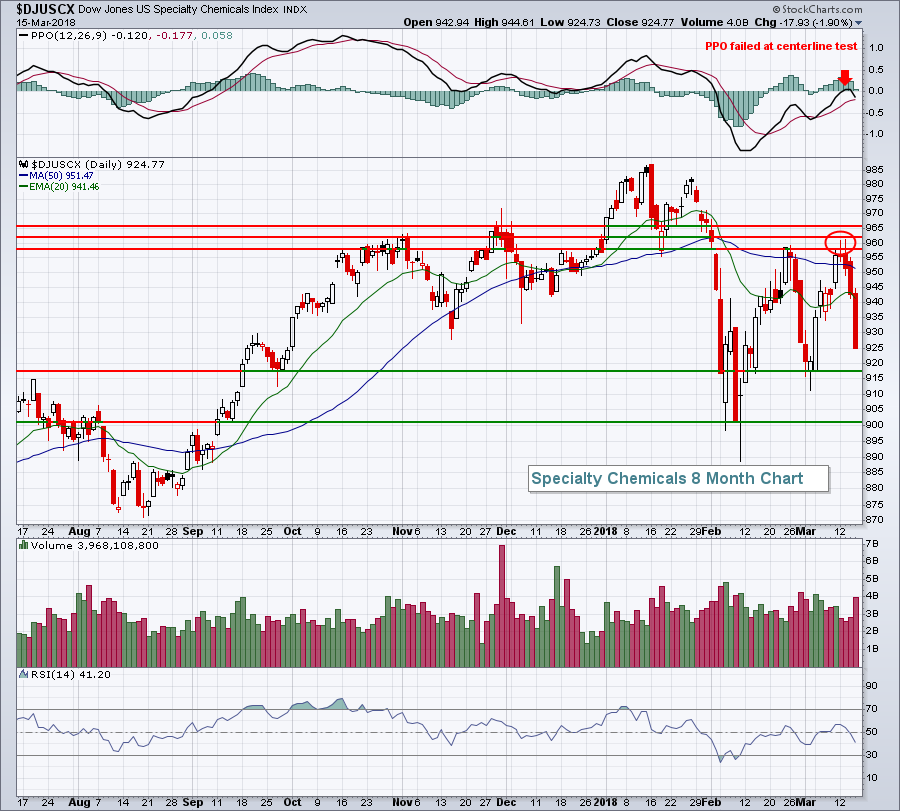
It was just another day of bifurcated action on Wall Street. But this time it featured a strengthening Dow Jones. The Dow gained 0.47%, while the S&P 500, NASDAQ and Russell 2000 fell 0.08%, 0.20% and 0.49%, respectively. From a sector perspective, it was a mixed bag as industrials (XLI, +0.29%), technology (XLK, +0.06%) and financials (XLF, +0.03%) were the only winners, while the day's big loser was materials (XLB, -1.31%). Specialty chemicals ($DJUSCX) has really struggled since failing to make a short-term price breakout earlier this week. Take a look:
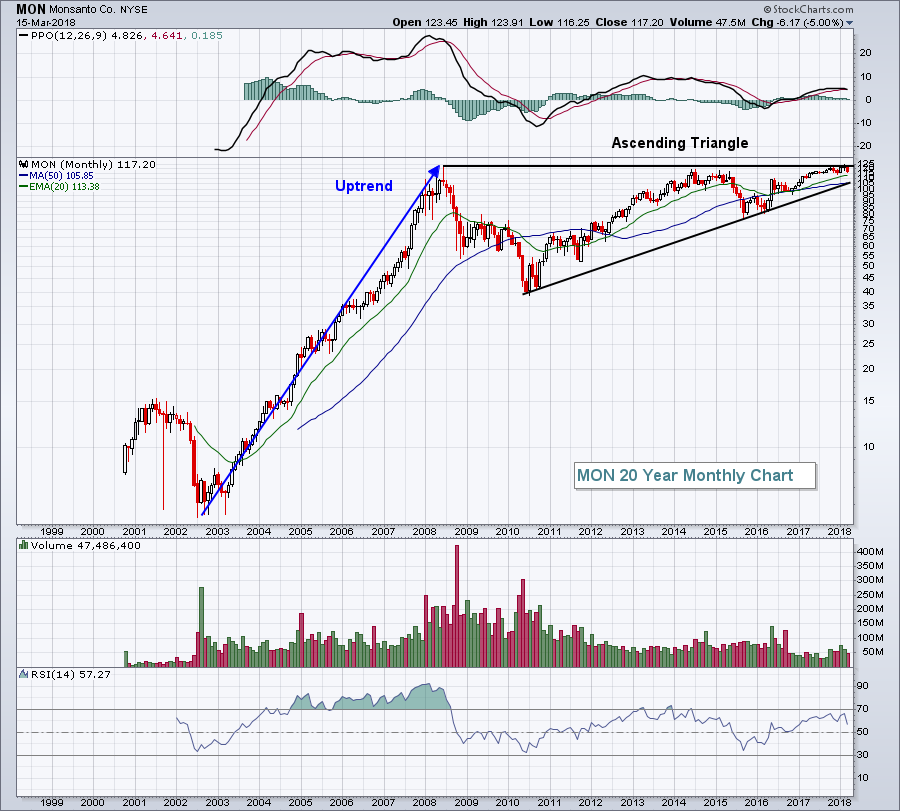
 We've seen a number of rallies halted in the 958-966 area, so until we can clear that area, trading in this space will be difficult. Yesterday's issue with the group centered around Monsanto Co (MON), which tumbled on more than 15 million shares after it was reported that AG Bayer faces U.S. antitrust issues in its merger attempt with MON. Competition was cited as the reason and AG Bayer will likely need to liquidate certain assets in order to proceed with the merger. That disappointment sent MON shares reeling from near all-time highs to completely eliminating all of its year-to-date 2018 gains. Still, the long-term monthly chart on MON looks very bullish with a likely breakout later in 2018. Here's that long-term bullish chart:
 While the antitrust issue might be viewed as a short-term obstacle, it appears to represent a long-term opportunity. The 105-110 area would represent a trendline entry point within this long-term bullish continuation pattern (ascending triangle).
Pre-Market Action
The 10 year treasury yield ($TNX), gold ($GOLD) and crude oil ($WTIC) are all near the unchanged level this morning. After the bell last night, Adobe Systems (ADBE) reported quarterly results that impressed traders as ADBE is up nearly 4% in pre-market trading.
Fractional losses were prevalent in Asia overnight, while fractional gains permeate Europe this morning. Here in the U.S., futures are essentially flat with 45 minutes left to the opening bell.
Current Outlook
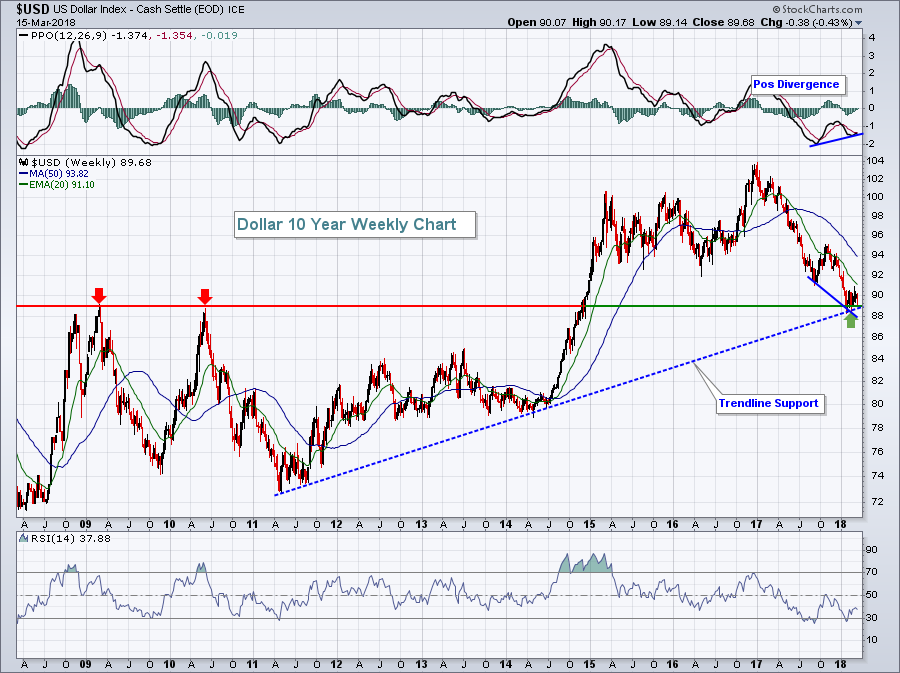
I see a number of technical signals that suggest the U.S. Dollar Index ($USD) is turning the corner and will begin a rally. I discussed in this blog yesterday the fact that the USD tends to follow the UST10Y-DET10Y (US 10 year treasury yield minus the German 10 year treasury yield) and I provided an argument for a big surge in the USD sooner rather than later to play catchup with that US-German bond market relationship. Today, let's look at the longer-term weekly chart on the USD:
 There's no doubt this is a pivotal area on the chart. We're testing both price and trendline support with a positive divergence on a long-term chart. There are never any guarantees, but based on the signs, expect a dollar surge. A much bigger test for the dollar bulls would come if the USD were to rally into the 93-95 zone. Given the relative weakness recently in the large multinational Dow Jones and S&P 500 companies, that's exactly what the market appears to be anticipating.
Sector/Industry Watch
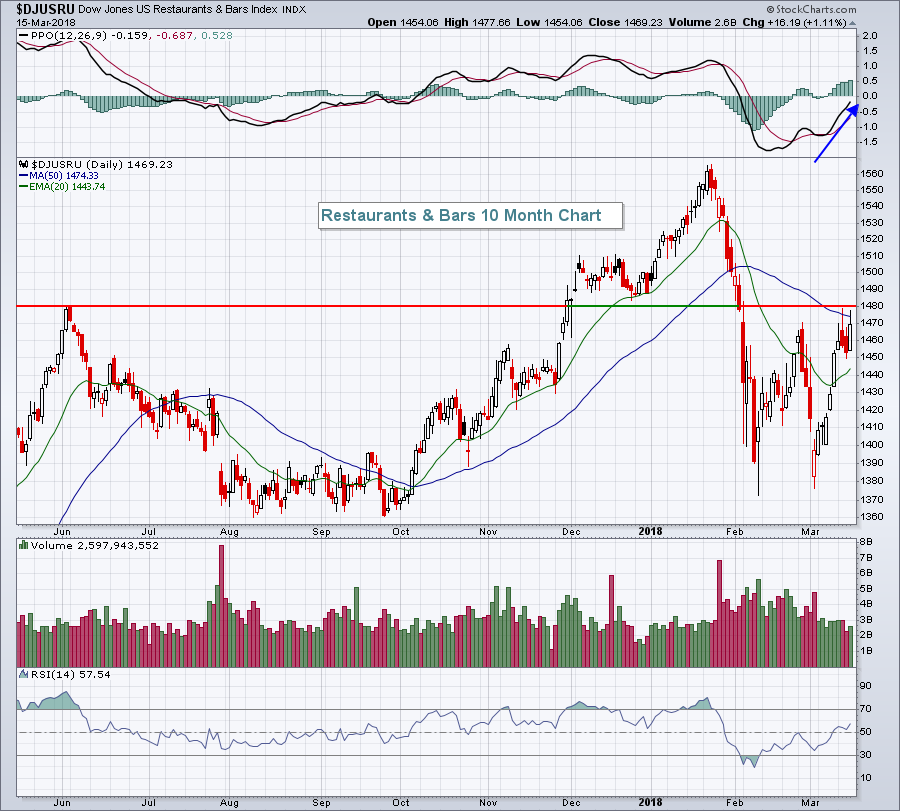
Restaurants & bars ($DJUSRU) was the only industry group to post a gain of more than 1% on Thursday. While the group was unable to clear overhead 50 day SMA resistance, it did manage to close at its highest level since early February. A close above 1480 would likely spur more technical buying:
 The PPO shows that price momentum is accelerating so a breakout above 1480 would confirm that notion.
Historical Tendencies
Yesterday I highlighted the S&P 500's preference for higher prices during the first half of calendar months (+11.48% annualized return from 1st through 15th vs. just +6.08% from 16th through 31st). Here's how the NASDAQ has performed since 1971:
1-15: +14.23%
16-31: +7.82%
Tomorrow, I'll take a look at the small cap Russell 2000.
Key Earnings Reports
(actual vs. estimate):
TIF: 1.67 vs 1.63
Key Economic Reports
February housing starts released at 8:30am EST: 1,236,000 (actual) vs. 1,285,000 (estimate)
February building permits released at 8:30am EST: 1,298,000 (actual) vs. 1,322,000 (estimate)
February industrial production to be released at 9:15am EST: +0.4% (estimate)
February capacity utilization to be released at 9:15am EST: 77.7% (estimate)
March consumer sentiment to be released at 10:00am EST: 98.8 (estimate)
Happy trading!
Tom
