Market Recap for Thursday, March 1, 2018
Any time the Volatility Index ($VIX) rises 13%, it's not going to be a great day on Wall Street. Fear equals selling and selling is exactly what we saw on Thursday. There was a bit of a late day rally, but it wasn't enough to avoid a short-term price breakdown. I posted previously that a key short-term price support zone on the benchmark S&P 500 resided at 2690-2700 and we lost it yesterday:
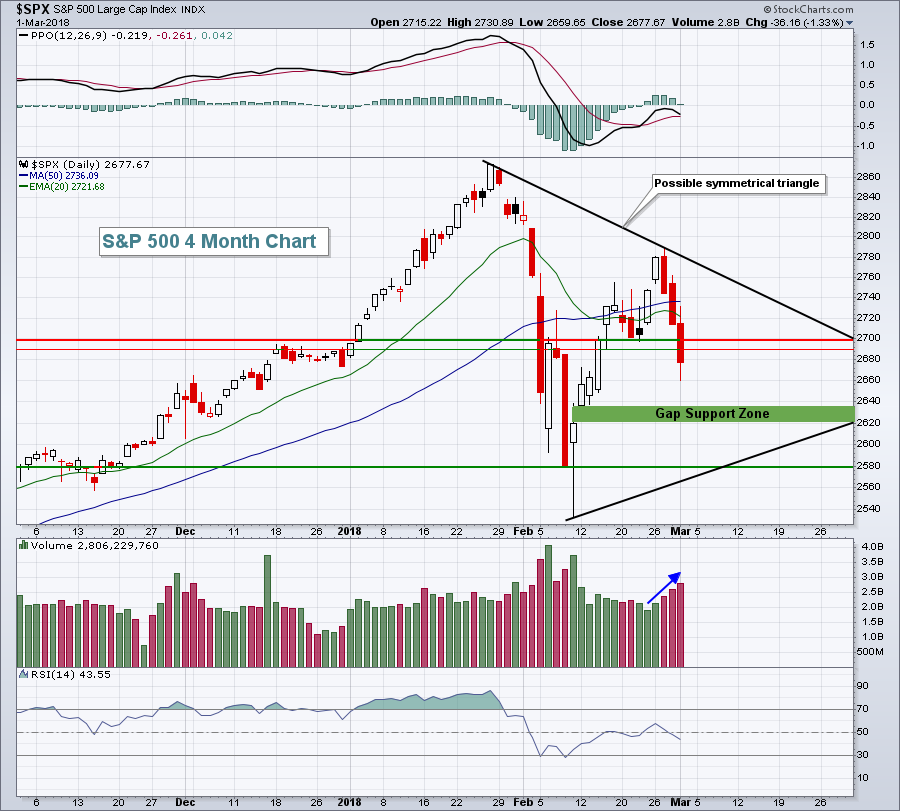 The 1.33% drop in the SPX now appears to set us up for a test of gap support in the 2620-2635 area.
Only utilities (XLU, +0.02%) managed to finish in positive territory on Thursday, with the other 8 sectors trying to control the damage technically. The worst performing sectors were industrials (XLI, -1.96%), as aerospace ($DJUSAS) fell from key price resistance, and financials (XLF, -1.73%). The DJUSAS is featured below in the Sector/Industry Watch section below. Technology (XLK, -1.66%) also struggled with recent leaders like semiconductors ($DJUSSC, -1.97%) taking big hits.
Pre-Market Action
Large global losses are spilling over into U.S. futures this morning with Dow Jones futures down more than 200 points as we approach the opening bell. Futures are actually rebounding from earlier lows, but it's clear that we're setting up for a weak open with a rising VIX - a very bearish short-term combination.
Current Outlook
The current problem with the market is no different than any other time in history when the VIX is elevated. Rapid selling can occur at any time with little or no provocation, make little sense and appear to have little or no support. Why? Well, I like to say market makers "go on vacation". These are the firms whose job it is to provide liquidity to the market. During bull market advances, they're more than happy to buy any time you'd like to sell, but in high volatile environments, history is on their side. They know what happens when prices deteriorate quickly. Panic sets in and prices get cheaper and cheaper and cheaper. From a bullish perspective, it's generally best to sit things out until the VIX prints a bearish reversing candle, our major indices print bullish reversing candles.....or both. We have yet to see that, but maybe later today? Who knows when it'll occur, but that's when I'd take another shot on the long side. The VIX still has room to move much higher in my opinion. The 25-35 zone tends to be where the VIX tops on secondary spikes. I use the analogy of earthquakes and after shocks. During the "market earthquake", the VIX can shoot to 50 like we saw earlier in February. During the "market after shock", VIX readings typically top in the 25-35 zone. Here's a chart to illustrate:
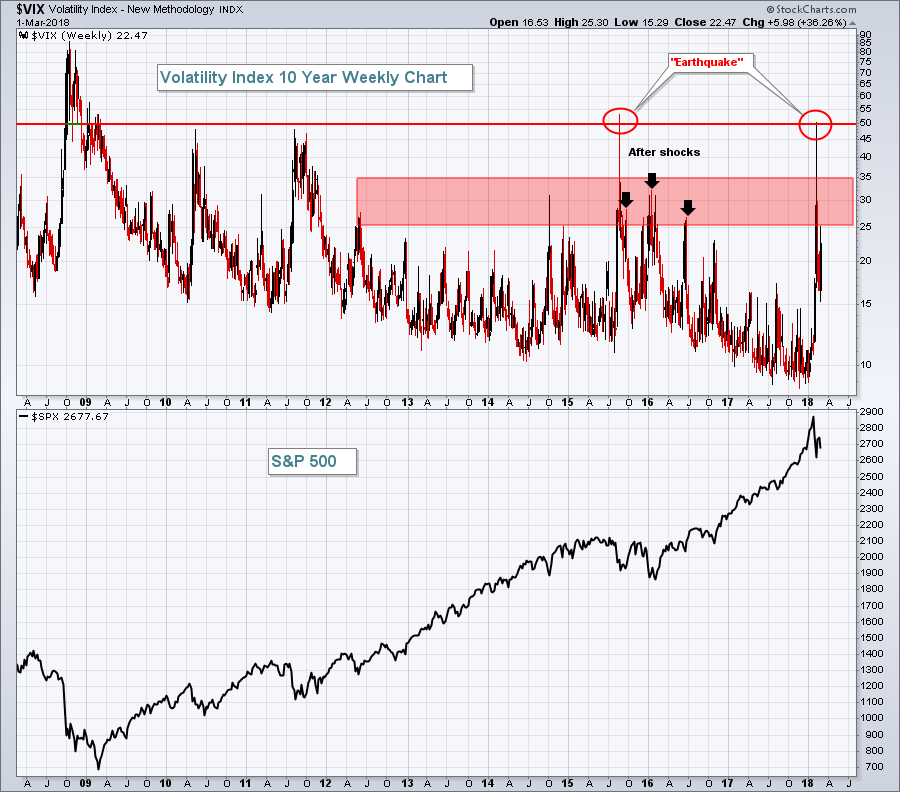 I think the VIX could hit the 30s again, but my guess is that this would coincide with a significant bottom. Whether it's below the early February low or above it remains to be seen. In either case, the "below the surface" signals tell me to remain long-term bullish.
Sector/Industry Watch
Boeing (BA) had a rough session, leading to a very weak Aerospace group ($DJUSAS). The DJUSAS is a very strong relative performer, but we just saw failure at key price resistance and now we're back into a downtrend. I'm looking for either rectangular consolidation or possibly an ascending triangle to form here:
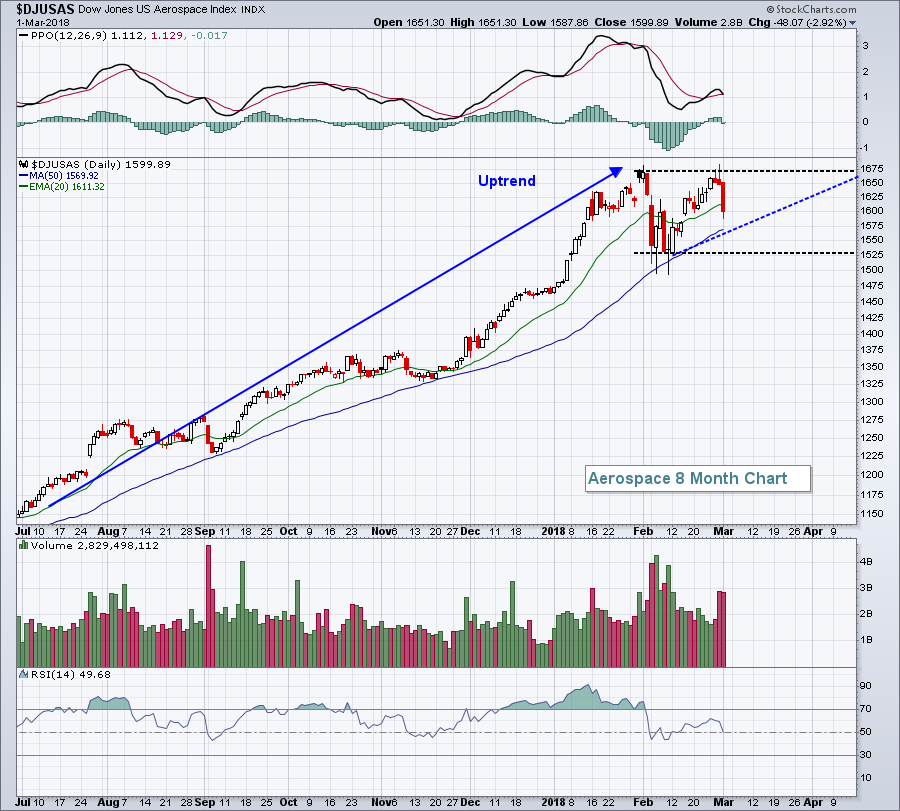 The black dotted lines represent a possible rectangular consolidation pattern to watch for, while the rising blue dotted line suggests perhaps an ascending triangle. Both would be bullish.
Historical Tendencies
For the second straight month, we're seeing a lot of market weakness to open a calendar month. That's quite unusual as the S&P 500 has produced the following annualized returns on each of the following calendar days since 1950:
1st day of month: +46.80%
2nd day of month: +38.09%
3rd day of month: +25.52%
4th day of month: -1.37%
5th day of month: +28.35%
6th day of month: +15.50%
Considering that the S&P 500 has produced average annual returns of 9% over the past 68 years, the first six calendar days of the month tend to be solid outperformers. That wasn't the case in February and so far not the case in March.
Key Earnings Reports
None
Key Economic Reports
February consumer sentiment to be released at 10:00am EST: 99.5 (estimate)
Happy trading!
Tom
