Market Recap for Thursday, April 26, 2018
Two familiar areas - technology (XLK, +1.82%) and consumer discretionary (XLY, +1.62%) - saw money rotate their way on Thursday, with especially strong action in both internets ($DJUSNS, +4.11%) and semiconductors ($DJUSSC, +2.35%) leading the technology space. Discretionary stocks were buoyed by home improvement retailers ($DJUSHI, +4.05%) as traders made a statement in the group despite the significant increase in the TNX in April:
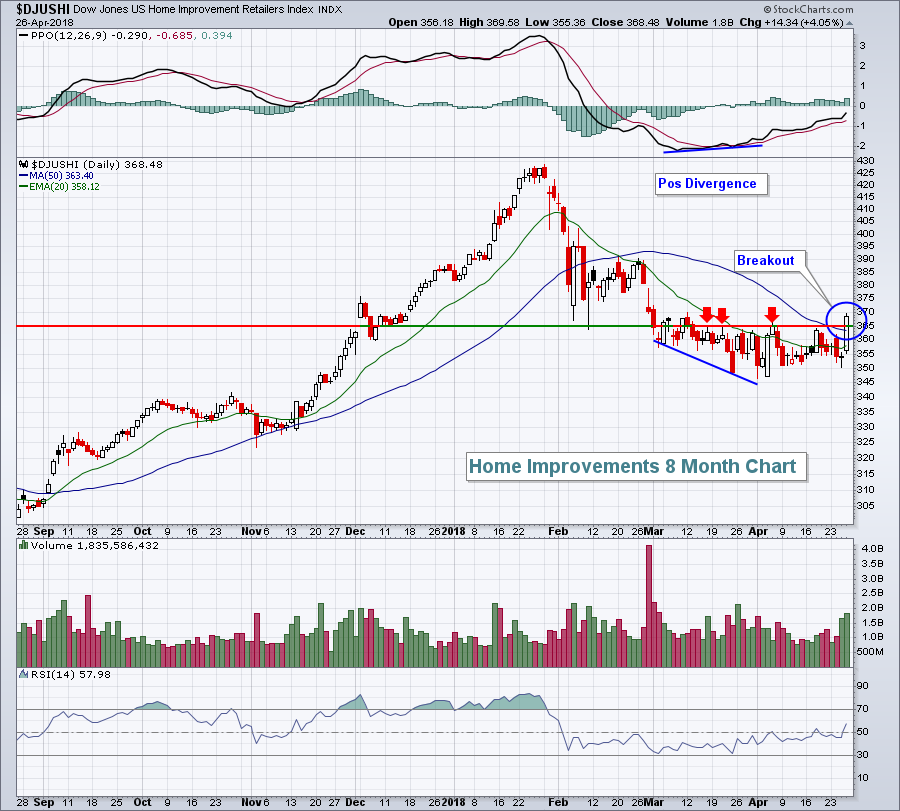 There was a positive divergence in play as selling momentum in the DJUSHI appeared to be subsiding. That was confirmed with the breakout above both recent price highs (red arrows) and the 50 day SMA (blue circle). The 370-380 area will provide gap resistance, so perhaps we'll see the DJUSHI hesitate there, but I'd look for pullbacks to now hold rising 20 day EMA support.
Industrials (XLI, -0.37%) were the clear loser and the only sector to finish in negative territory. The reason? Transports ($TRAN, -0.90%) were very ugly early in the session. They did rally quite a bit, but the three key areas - trucking ($DJUSTK, -2.95%), airlines ($DJUSAR, -2.51%) and railroads ($DJUSRR, -1.99%) - finished as the three worst industry groups among industrials. There was a silver lining in the truckers, however, as price support was violated intraday, but held at the close:
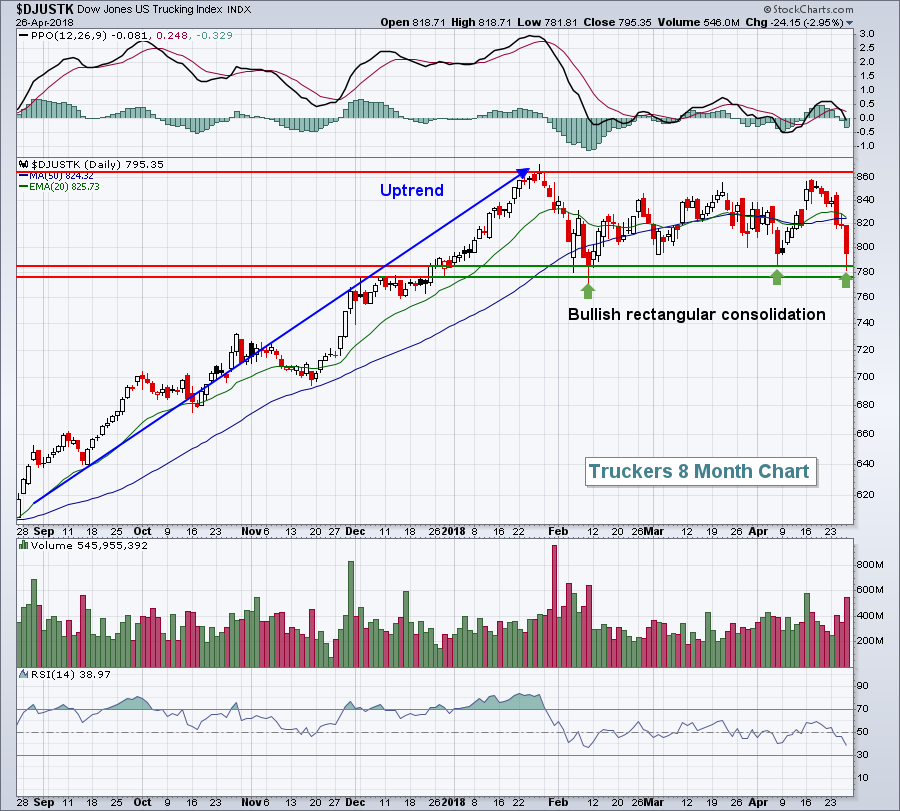 I'm looking for a short-term rally in truckers as the reward to risk now favors being long.
Pre-Market Action
Amazon.com (AMZN), Microsoft (MSFT) and Intel (INTC) all delivered better-than-expected quarterly earnings results after the bell yesterday and that trio is set to lead another early advance in the NASDAQ and NASDAQ 100.
We're seeing mostly global strength in equities this morning as earnings pour in here in the U.S. The 10 year treasury yield ($TNX) has dropped back to 2.97% as it establishes a new short-term trading range. For me, I expect that range will be 2.90%-3.05% with MAJOR YIELD RESISTANCE at that 3.05% level. Psychologically, I believe 3.05% will mean more than 3.00%. A breakout above that level should send traders into banks ($DJUSBK) in a big, big way so keep an eye on that.
The initial reading of Q1 GDP hit the wires a few minutes ago and it was better than expected, +2.3% vs +2.0%.
NASDAQ futures are getting a lift from AMZN in particular, but Dow futures remain in negative territory, down 59 points with a little more than 30 minutes left to the opening bell.
Current Outlook
Our major indices continue to seek out fresh leadership for another bull market rally. Energy (XLE) has been trying to fulfill that role and yesterday the Dow Jones U.S. Exploration & Production Index ($DJUSOS) made a bold statement in that regard:
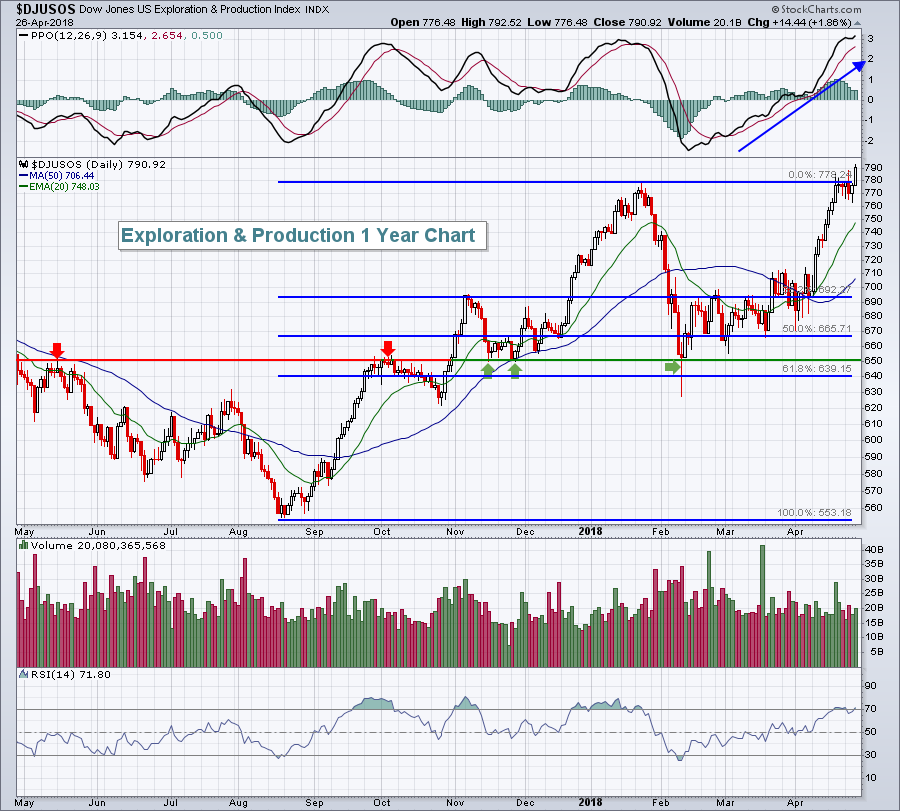 Outside of short-term overbought conditions, the DJUSOS looks very strong technically as it broke out to another new high after a brief period of consolidation. We've seen significant weakness in other key areas that led the most recent bull market rally, like internet ($DJUSNS) and semiconductor ($DJUSSC) stocks, so it's imperative to find new groups to help lead the next rally like the DJUSOS.
Sector/Industry Watch
Technology (XLK) led all sectors on Thursday and, while there's been a ton of volatility and rotation back and forth, technically the XLK remains on track for further highs. The chart below still shows a string of higher highs and higher lows, the primary ingredient of an uptrend:
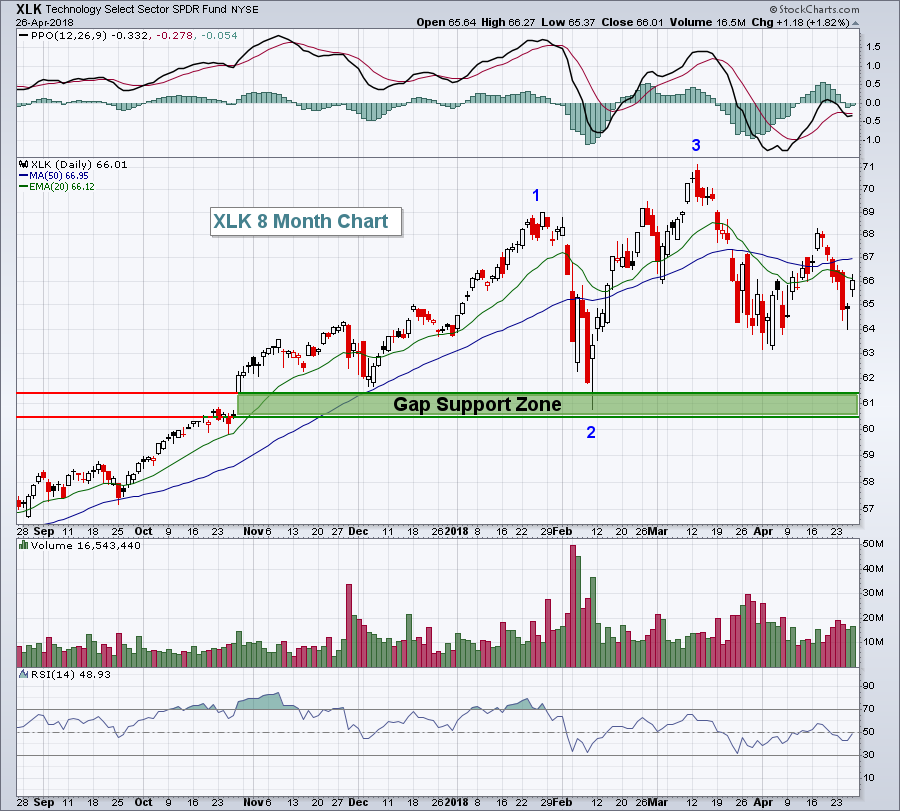 A definitive break above the PPO centerline would be a positive technically. Until then, simply expect more consolidation.
Historical Tendencies
When you consider that the S&P 500 has gained an average of 9% per year since 1950, the following annualized returns by calendar day is worth noting:
28th: +20.53%
29th: +19.50%
30th: +12.87%
31st: +29.99%
1st: +46.80%
2nd: +38.09%
3rd: +25.52%
4th: -1.37%
5th: +28.35%
6th: +15.50%
You should especially note those gains on the 31st, 1st and 2nd calendar days of the month. They highlight the power of "window dressing" and money flows.
Key Earnings Reports
(actual vs. estimate):
CHTR: .70 vs .44
CL: .74 vs .73
COL: 1.81 vs 1.75
CVX: 1.45 (estimate - still awaiting results)
D: 1.14 vs 1.03
HMC: .56 vs .46
LYB: 3.11 vs 2.80
MCO: 2.02 vs 1.78
PSX: 1.04 vs .91
RBS: .18 (estimate - still awaiting results)
SNY: .79 vs .74
SPG: 2.87 vs 2.83
TRP: .78 vs .64
WY: .36 vs .33
XOM: 1.09 vs 1.14
Key Economic Reports
Q1 GDP released at 8:30am EST: +2.3% (actual) vs. +2.0% (estimate)
April consumer sentiment to be released at 10:00am EST: 98.0 (estimate)
Happy trading!
Tom
