Market Recap for Wednesday, May 16, 2018
We saw another advance on Wall Street on Wednesday as key indices continue to clear important hurdles. Perhaps the most significant yesterday was the Russell 2000, which ended its bullish continuation pattern as expected - with a bullish breakout to the upside:
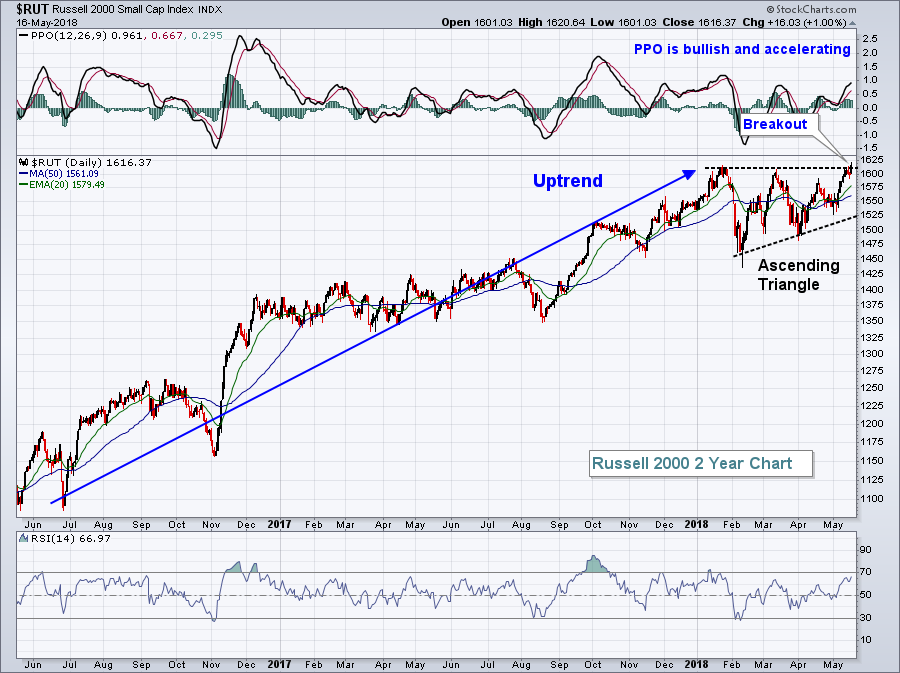 It's never a bad thing to see the more aggressive small caps leading the market to the upside and having a pattern measurement only aids the bulls in terms of targets down the road. From top to bottom in this ascending triangle pattern, it measures 175 points. Add that to the breakout level of 1610 and we come up with an initial target of 1785. That provides us with a potentially exciting summer advance.
It wasn't just about small caps yesterday, though. One of the Dow Jones components - Nike (NKE) - helped to lead a very strong footwear group ($DJUSFT) with a breakout of its own:
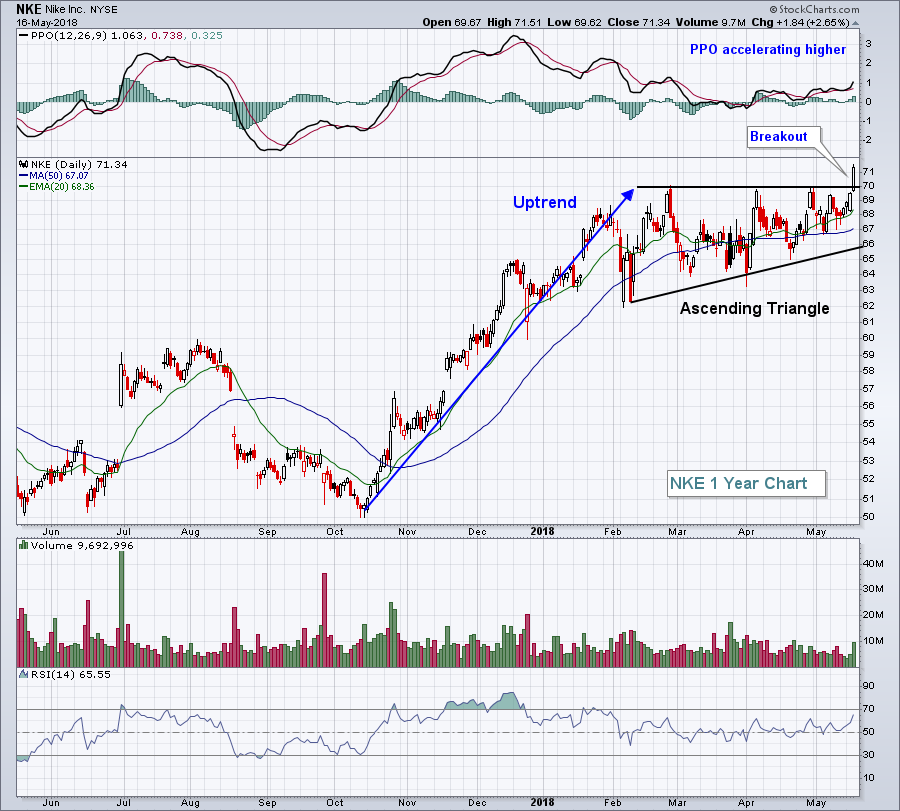 If there was one downside to NKE's performance, it's that volume could've been a bit heavier. It definitely picked up and was the heaviest of the past few weeks, but it wasn't off-the-chart type volume. Still, NKE looks very bullish to me.
The DJUSFT helped to pace the consumer discretionary stocks (XLY, +0.83%) to a second place finish on the sector leaderboard. Materials (XLB, +1.19%) were very strong despite the U.S. Dollar Index ($USD) closing at its highest level of 2018.
Pre-Market Action
Crude oil prices ($WTIC) have crept above $72 per barrel this morning and it'll be very interesting to see if this results in a breakout of the XLE (see Sector/Industry Watch section below). Asian markets were mixed overnight and Europe is higher this morning.
With 30 minutes left to today's opening bell, Dow Jones futures are lower by 33 points.
Current Outlook
I have a very interesting theme to watch over the next several weeks. The 10 year treasury yield ($TNX) has been on the rise, breaking out to 7 year highs. There's been a strong correlation between the direction of the TNX and the direction of the Dow Jones U.S. Life Insurance Index ($DJUSIL):
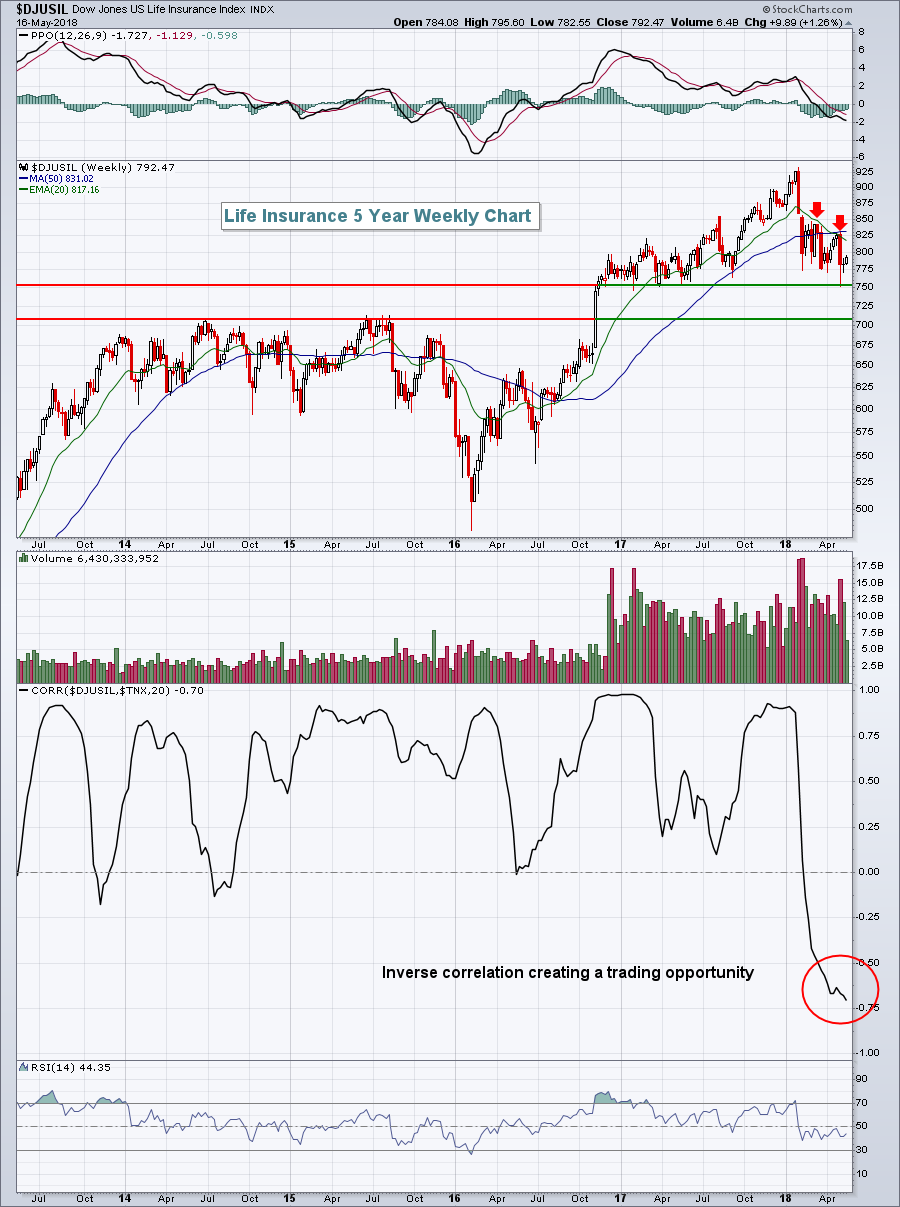 There's definitely a positive correlation that exists between treasury yields and the performance of life insurance stocks as correlation typically resides above 0. But that correlation has turned negative and that means one of two things is likely to occur over the next several weeks. Either we'll see the TNX correct lower to mirror the direction of the DJUSIL.....or we'll see life insurance stocks rapidly recover to move more in step with the TNX. I'm betting on the latter.
Sector/Industry Watch
Energy (XLE) has moved into the top SCTR spot among sectors with a 96 score. But the XLE now shows RSI overbought at 76, which typically results in consolidation or selling. So what's the plan for energy from here?
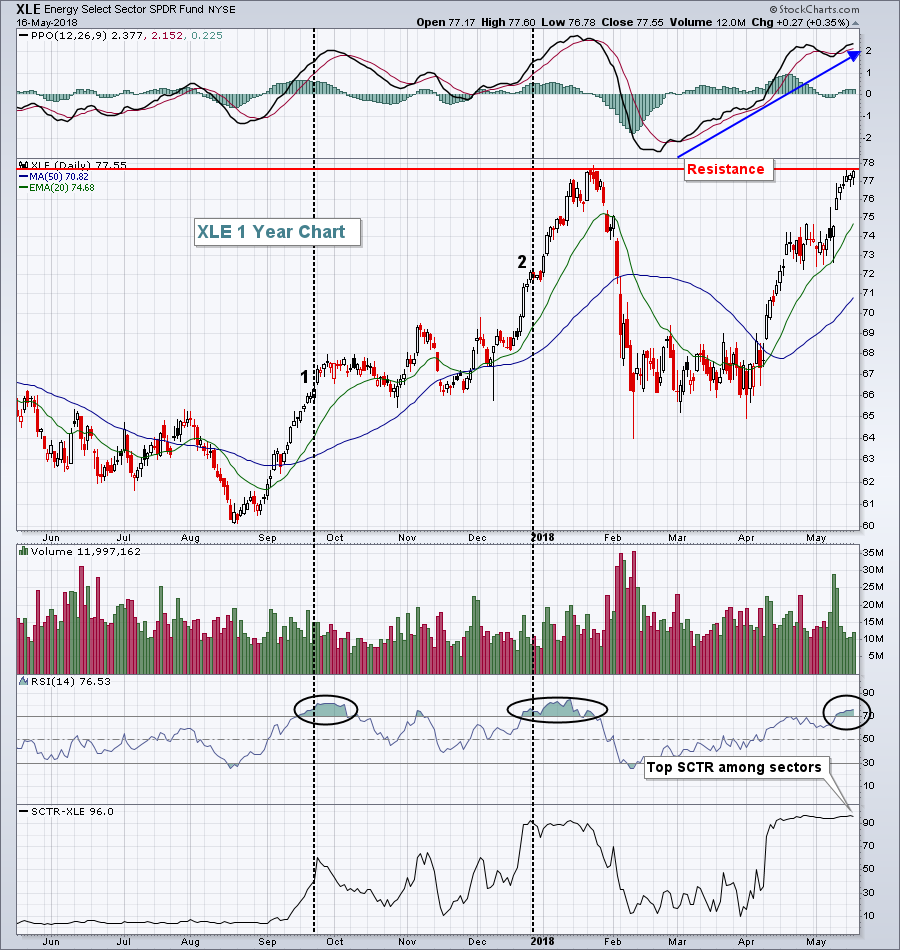 You can see what happened the last two times the XLE was advancing but hit an RSI level above 70. The first, in September, resulted in sideways consolidationas the RSI worked its way back to 40. The last, in December, saw another 8% advance before succumbing to selling pressure. The moral of the story is that overbought can remain overbought, but risks are elevated. At some point soon, we'll likely see money rotate away from energy into other sectors and key price resistance certainly could be that time. Therefore, if I was looking for entry into the XLE, now is not the time. I'd either wait for a pullback to the rising 20 day EMA or wait to make sure the breakout occurs. Crude oil prices ($WTIC) remain strong and in a solid uptrend, so I don't believe the XLE rally is over. In fact, I suspect energy will participate strongly in the next phase of the current bull market. But an unwinding of the overbought RSI first would be welcome relief and would aid the reward to risk entry into the group.
Historical Tendencies
Business training & employment agencies ($DJUSBE) have seasonally been the worst performing industry group during May over the past two decades. It hasn't been a horrible May this year thus far (+1.82%), but the group has clearly lagged the overall market as the benchmark S&P 500 has gained 2.81% month-to-date. Over the past 15 years, the DJUSBE has underperformed the S&P 500 86% and 79% of the time during the months of April and May, respectively. May 2018's underperformance is simply par for the course.
Key Earnings Reports
(actual vs. estimate):
WMT: 1.14 vs 1.12
(reports after close, estimate provided):
AMAT: 1.13
JWN: .42
Key Economic Reports
Initial jobless claims released at 8:30am EST: 222,000 (actual) vs. 215,000 (estimate)
Philadelphia Fed survey released at 8:30am EST: 34.4 (actual) vs. 21.0 (estimate)
April leading economic indicators to be released at 10:00am EST: +0.4% (estimate)
Happy trading!
Tom
