Market Recap for May 2, 2018
Well, the Fed spoke and Wall Street listened. While there weren't any dire warnings from the Fed about inflation, simply acknowledging that inflation could be returning to its target 2% rate spooked traders for an afternoon. If you were wondering if the Fed's policy statement led to the market weakness on Wednesday, just look at an intraday chart:
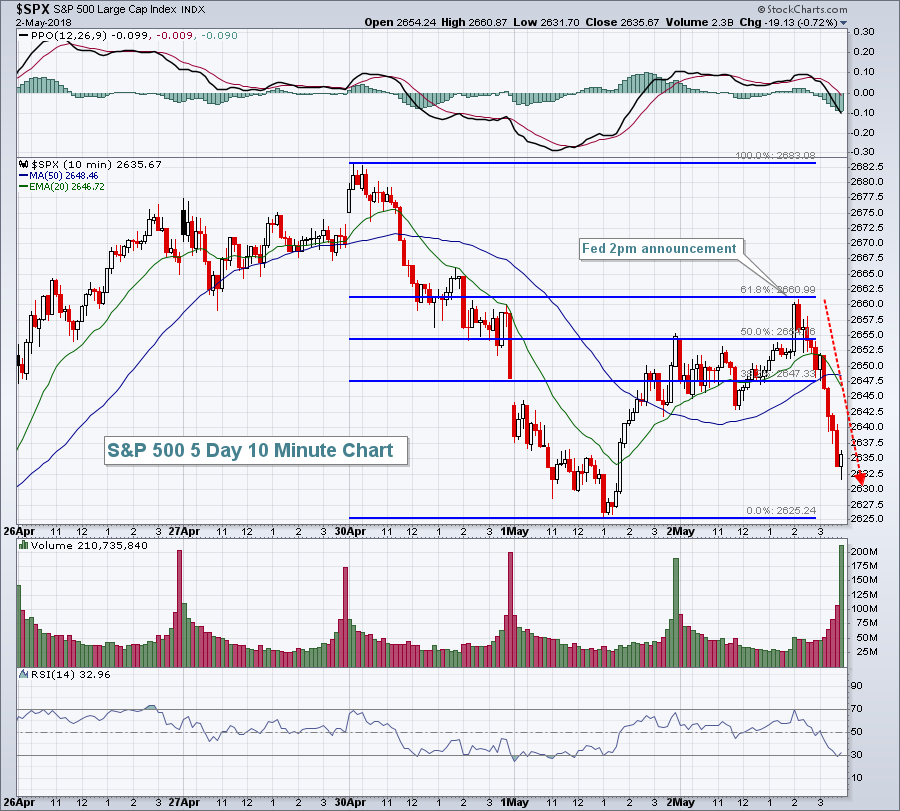 The S&P 500 had dropped nearly 60 points, or more than 2%, prior to bouncing into the FOMC announcement. In fact, that bounce was exactly a 61.8% Fibonacci retracement of the prior decline. Short-term, Tuesday's low near 2625 is important, but the intermediate-term support is 2581 as we've already printed a double bottom there:
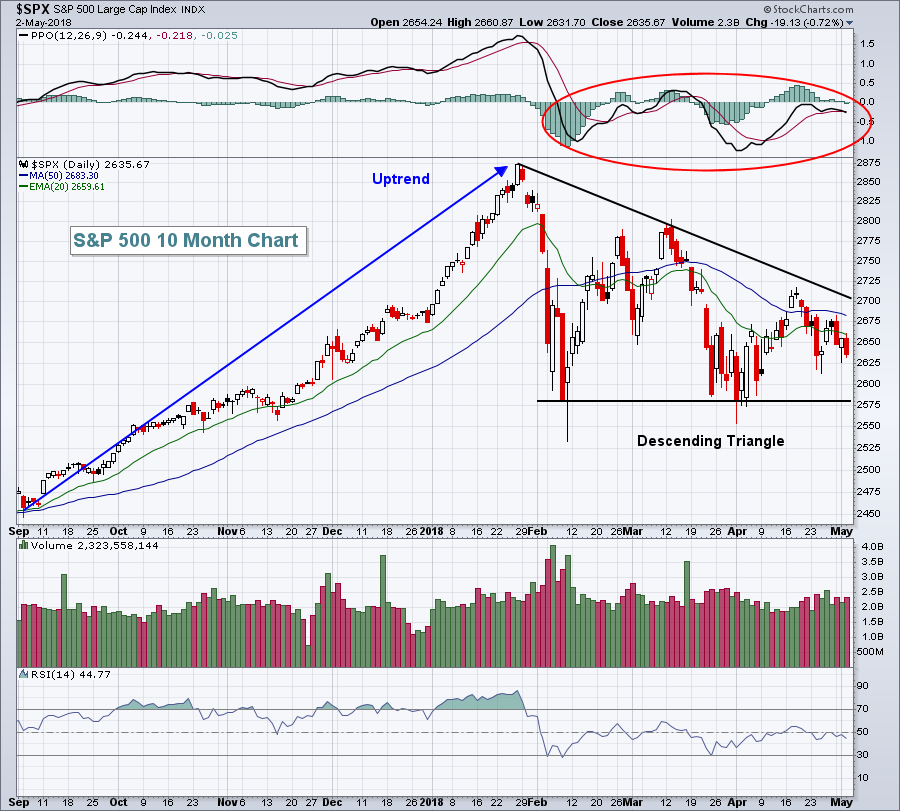 Triangles are consolidation patterns and typically resolve themselves in the direction of the prior trend. In this case, the prior trend was clearly an uptrend. Therefore, I'm expecting a breakout. Having said that, ascending triangles are much more bullish than descending triangles as the psychology behind the ascending triangle shows that bulls are adamant about retesting resistance until they can finally break through. In the case of descending triangles, repeated threats to break support carry the opposite psychological effect. The lower highs throughout the triangle suggest demand is waning, so we must be prepared if support is lost.
So the consolidation/frustration rages on for the bulls and bears alike. Energy (XLE, +0.41%) was the only sector to end the day in positive territory. The afternoon selling resulted in our major indices all finishing with losses and eight of nine sectors did the same. Consumer staples (XLP, -1.96%) was once again the primary target of sellers, this time with brewers ($DJUSDB) taking the biggest hit. Molson Coors Brewing (TAP, -15.40%) was hammered after disappointing results. Over the past three months, the XLP has plunged 12.69%, while more aggressive sectors like technology (XLK) and consumer discretionary (XLY) have lost 0.10% and 2.04%, respectively, by comparison.
Pre-Market Action
Gold ($GOLD) is up $11 per ounce this morning and it makes sense technically to see a bounce here. Gold hit price and 200 day SMA support on Wednesday, so a rally here is justified technically. Also, with the Fed hinting at slightly higher inflation, a move up in gold would not be a surprise either:
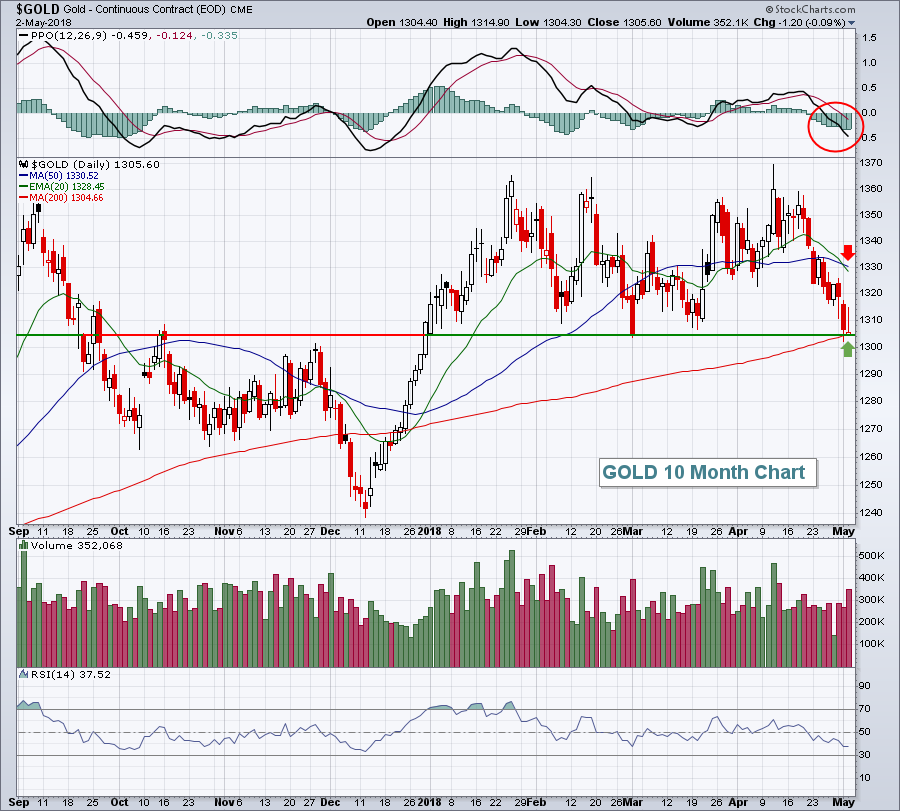 The PPO is suggesting an acceleration of downward momentum, but a bounce back to test its declining 20 day and 50 day moving averages is not out of the question. For now, I'd consider gold to be in a $1300-$1330 trading range.
Mixed action in Asia overnight and mild profit taking in Europe after recent strength is highlighting today's action. Earnings continue to pour in here in the U.S., although few companies have been rewarded, despite mostly solid results.
Dow Jones futures are down 105 points with a little less than an hour to the opening bell.
Current Outlook
The Fed talked a bit about higher inflation to reach its 2% target level. Yet we've seen the dollar rising significantly the past 2-3 weeks. If the dollar rises, that should contain inflation concerns.....or should it? Take a look at this chart:
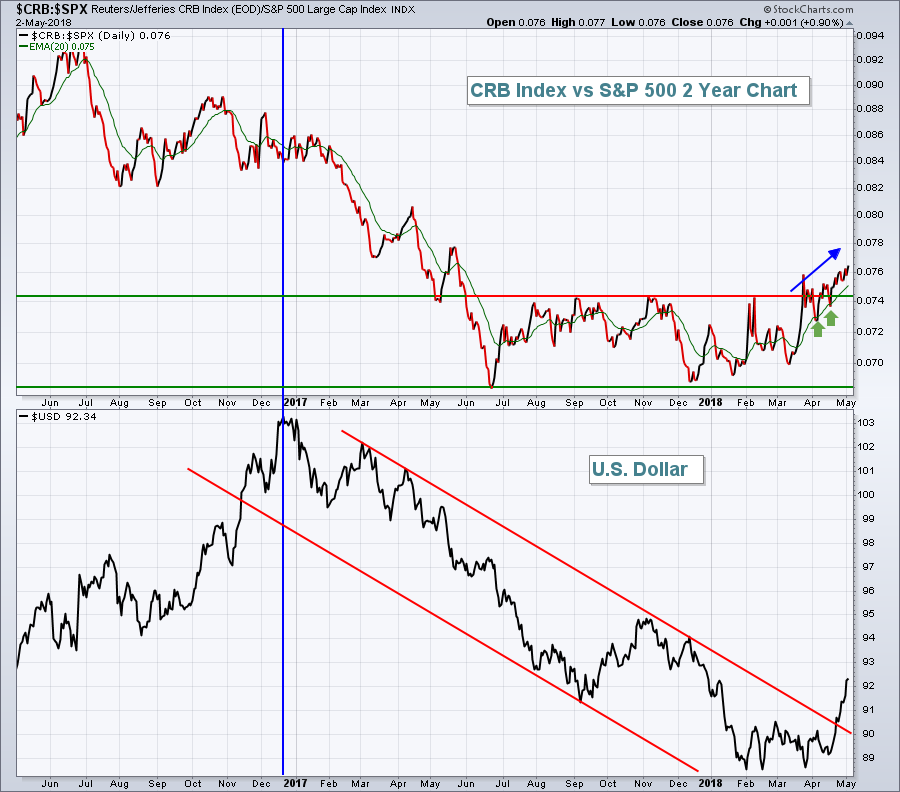 This chart shows us that the CRB Index ($CRB) doesn't always perform vs the benchmark S&P 500 ($CRB:$SPX) in inverse fashion when compared to dollar performance ($USD). There's no denying that a rising dollar will provide headwinds for commodities (especially gold), but if economic conditions are strengthening faster in the U.S., that results in more rapidly rising treasury yields here, in turn strengthening the dollar. But strengthening economic conditions will also increase demand for commodities, which is why there's a long-term positive correlation between crude oil ($WTIC) and the S&P 500. As you can see from the above, the dollar has broken its down channel and commodities are rising vs. the S&P 500.
Sector/Industry Watch
Banks ($DJUSBK) took another hit on Wednesday and if there's one thing that would really grab my attention from a bearish perspective, it'd be a breakdown of the DJUSBK during a period of rising 10 year treasury yields ($TNX). A higher TNX almost always translates into higher bank profits and higher bank prices. Yet, for some reason, banks are not performing as I would expect given the rapid ascent in the TNX. I'll give the banks the benefit of the doubt so long as their 2018 price support holds. If that fails to hold, it would definitely be a dagger for the bulls. Here's the chart and the level to watch:
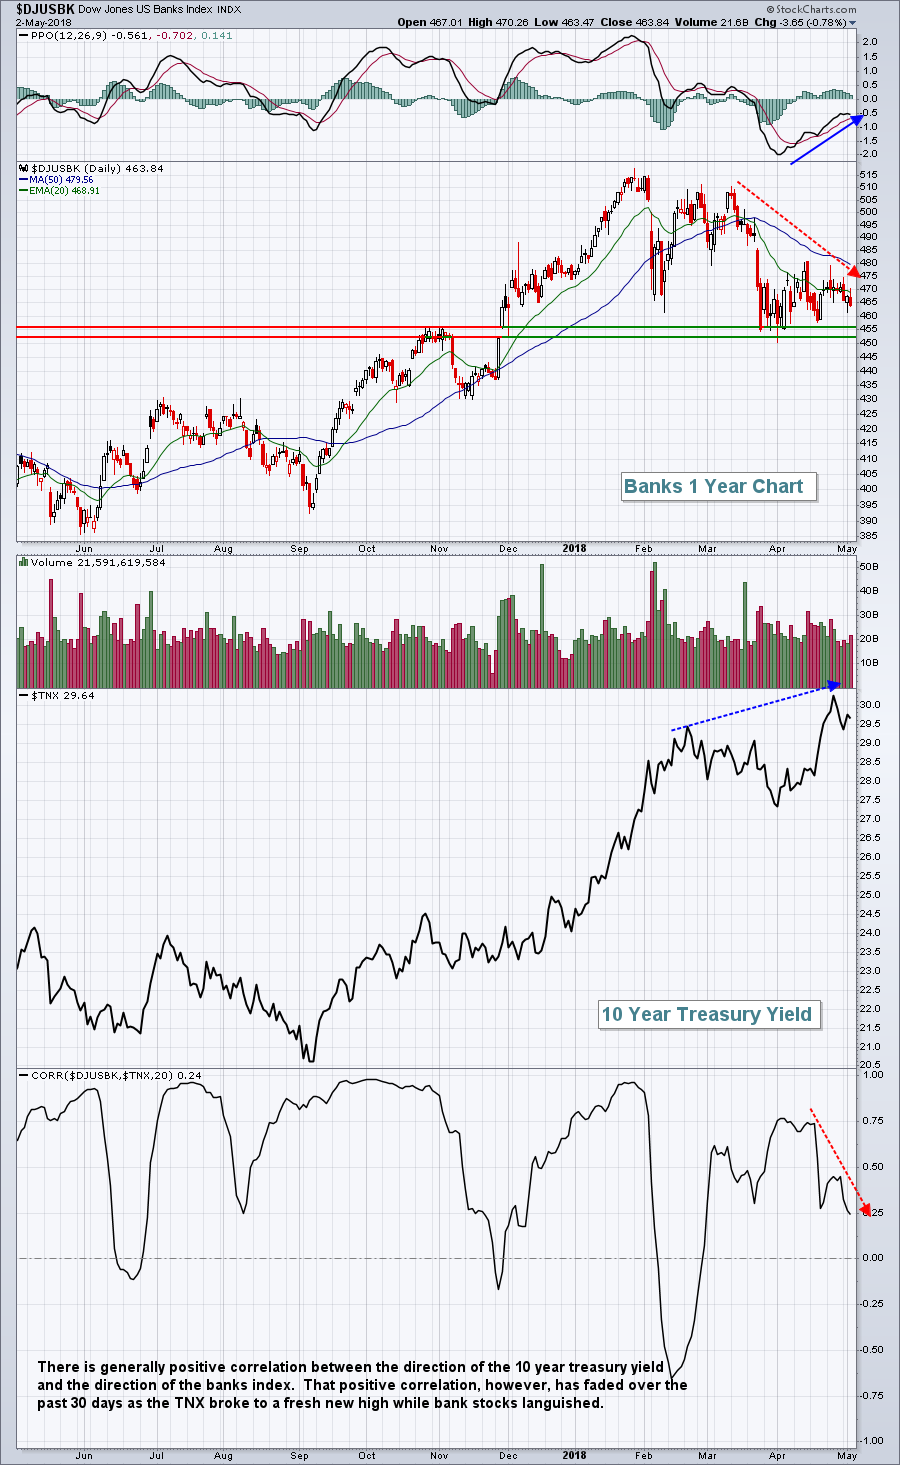 Ultimately, I expect to see the positive correlation return here, but if the DJUSBK loses price support in the 450-455 range, look for volatility to soar again as S&P 500 support at 2581 also is lost. I would be extremely cautious (100% cash) in the near-term if 2581 is lost on the S&P 500.
Historical Tendencies
I posted recently that early May tends to be very bullish historically. Thus far, despite several very solid earnings reports, including Apple (AAPL), that tendency has not resulted in higher prices in 2018. The May 6th to May 25th period is typically much more challenging as you can see from the annualized returns below for our major indices:
S&P 500 (since 1950): -12.71%
NASDAQ (since 1971): -5.58%
Russell 2000 (since 1987): -9.54%
Key Earnings Reports
(actual vs. estimate):
BDX: 2.65 vs 2.61
CAH: 1.39 vs 1.51
CI: 4.11 vs 3.37
CNQ: .56 vs .57
DWDP: 1.12 vs 1.08
ICE: .90 vs .88
GGP: .35 vs .37
GPN: 1.13 vs 1.09
K: 1.19 vs 1.07
PPL: .74 vs .66
REGN: 4.67 vs 4.51
(reports after close, estimate provided):
ANET: 1.52
ATVI: .35
CBS: 1.19
EC: .41
ED: 1.33
EOG: 1.01
FMS: .70
MSI: .86
SWKS: 1.60
Key Economic Reports
Initial jobless claims released at 8:30am EST: 211,000 (actual) vs. 224,000 (estimate)
Q1 productivity released at 8:30am EST: +0.7% (actual) vs. +0.9% (estimate)
April PMI services index to be released at 9:45am EST: 54.4 (estimate)
March factory orders to be released at 10:00am EST: +1.3% (estimate)
April ISM non-manufacturing index to be released at 10:00am EST: 58.4 (estimate)
Happy trading!
Tom
