Market Recap for Monday, May 7, 2018
There was plenty of green on Monday, adding to the gains we saw late last week. The only areas of the market that struggled were the defensive consumer staples (XLP, -0.62%) and utilities (XLU, -0.52%). On the flip side, money rotated once again to the more aggressive sectors - technology (+0.70%), financials (XLF, +0.66%), industrials (XLI, +0.66%) and consumer discretionary (XLY, +0.34%). This has been a theme throughout the recent consolidation and does not provide a picture of a bear market ahead. For an update of key sectors' relative strength, check out the Current Outlook section below.
Footwear ($DJUSFT, +1.65%) was the consumer discretionary leader and its primary component - Nike (NKE) - is set up beautifully in an ascending triangle pattern. A breakout would measure to 76.00 or so:
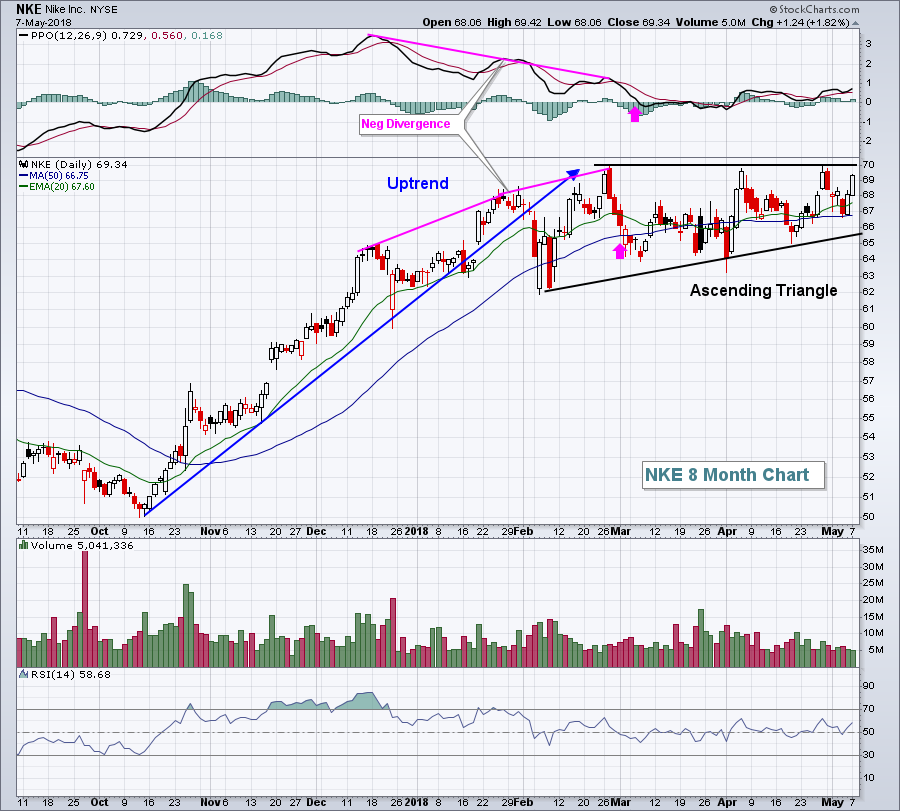 This NKE chart could be a poster child for technical analysis. After the nice uptrend, momentum slowed, a negative divergence printed and that marked a short-term top. Consolidation was to be expected at that point and NKE cooperated with a bullish ascending triangle taking shape. Volume has dissipated and the PPO is just beginning to turn higher. A breakout above 70 with increasing volume would confirm the pattern and my expectation would be a trip to 76, then possibly higher.
Aerospace ($DJUSAS, +1.49%) performed quite well for a third day in a row, but volume trends have been weak of late. The good news is that after a steady march higher into its double top in February, the DJUSAS is consolidating in a bullish wedge:
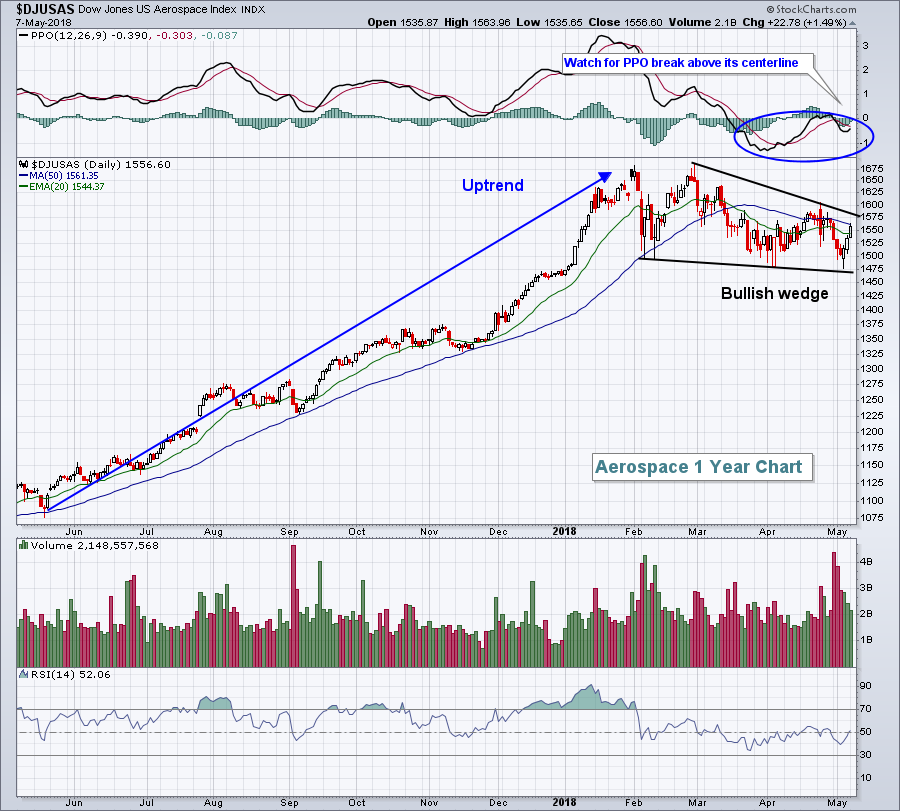 Momentum has been negative here for the past few months, but RSI has mostly been holding above 40 and a break to the upside out of the current wedge pattern would be extremely bullish.
Pre-Market Action
Crude oil prices ($WTIC) are backing off their 3 1/2 year highs that were established on Monday. Currently, the WTIC is down nearly 1%, but still holding the $70 per barrel level. Gold ($GOLD) and the 10 year treasury yield ($TNX) are relatively flat.
Asian markets were strong overnight, but Europe has turned lower, especially in Germany after the DAX approached the 13000 level at yesterday's close.
Dow Jones futures are lower by 39 points with just under 45 minutes to the opening bell.
Current Outlook
One common sense ingredient of market action leading up to a bear market would be the rotation out of aggressive sectors as the benchmark S&P 500 makes a final fateful failed move to the upside. That simply hasn't occurred. Instead, we've been seeing opposite action with much of the selling concentrated primarily in defensive areas of the market. The following chart will provide you a visual:
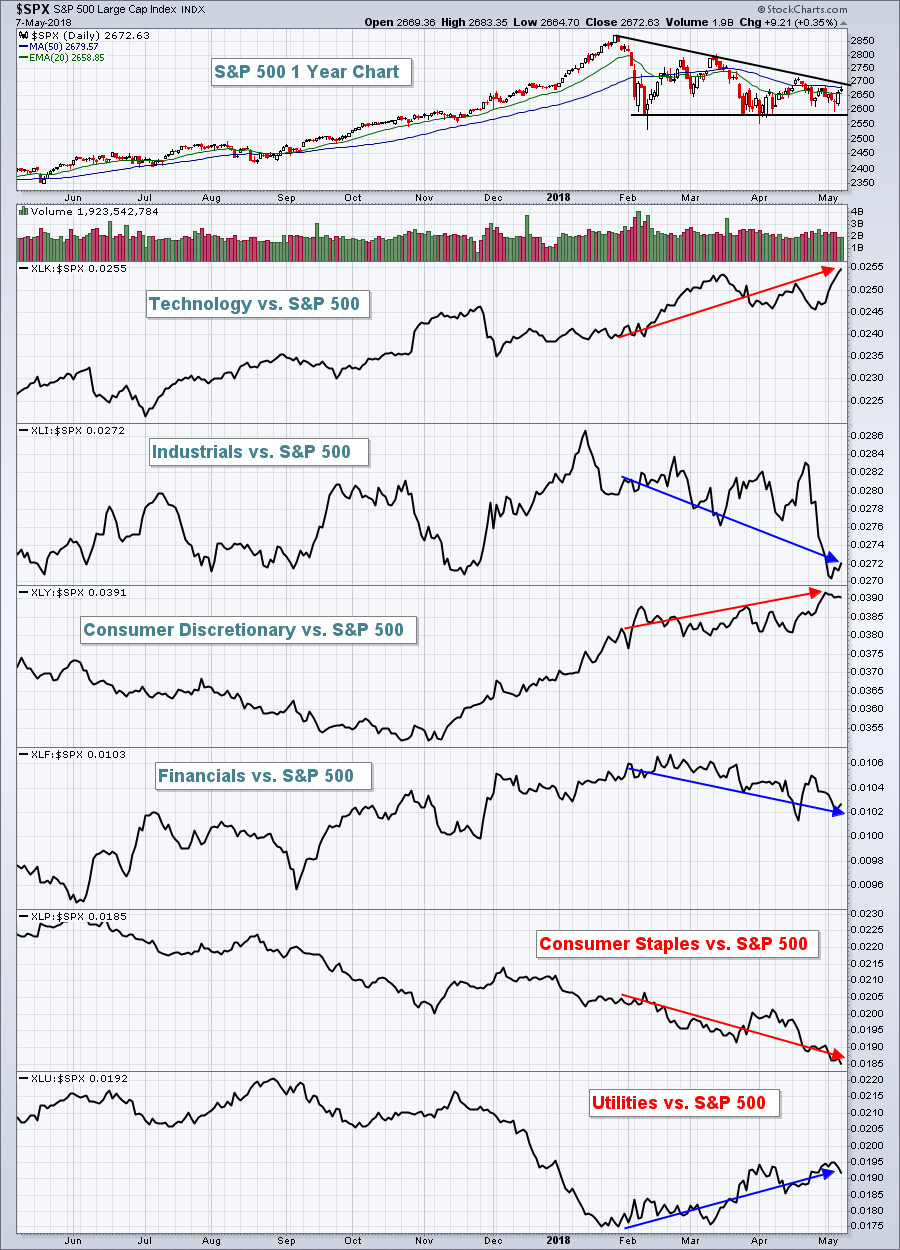 If you study history, you'll find that the aggressive areas tend to underperform the S&P 500 during periods of consolidation or selling, while defensive areas tend to outperform. That "normal" behavior is highlighted above with blue directional lines. The red directional lines highlight the opposite, however. These red lines are what we'd expect to see during a rising bull market. I find this to be a very bullish "under the surface" signal as portfolio managers would be moving away from aggressive areas leading up to a bear market to protect against a significant decline. That's not the case and I find it to be bullish. It's just my opinion, so feel free to disagree if you'd like.
Sector/Industry Watch
Crude oil ($WTIC) closed above $70 per barrel for the first time since November 2014 on Monday and energy stocks have been on relative fire throughout this crude oil uptrend:
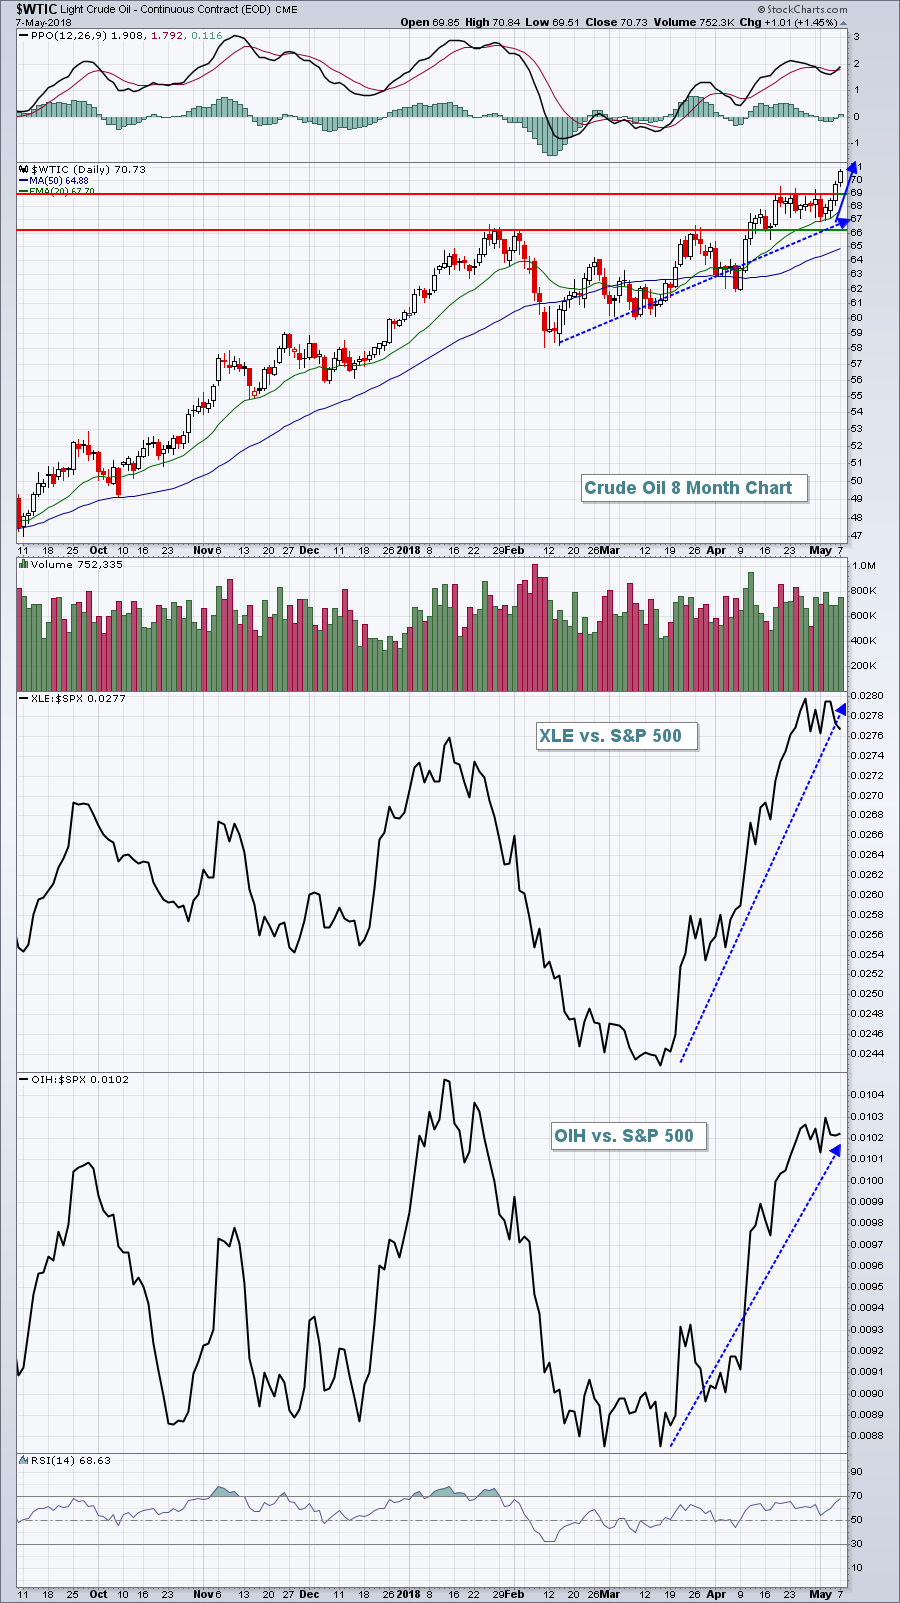 I believe crude oil is headed for $80 per barrel with likely consolidation after that between $65 and $80. That should provide many energy shares with the oil price they need to generate increasing profits. I don't know that the XLE will be the best performing sector, but I do think this sector will participate significantly in the next phase of the current bull market and I'll be looking to trade shares within this space as a result.
Historical Tendencies
Walt Disney Co. (DIS) reports its latest quarterly results after the bell today. DIS has seen increasing volume lift its shares the past couple days after a hammer printed last Thursday at key price support near 98.00. May tends to be an "ok" month for DIS, averaging a 1.0% gain over the past two decades. But DIS struggles over the summer months, with 20 year average monthly returns as follows:
June: -2.4%
July: -0.2%
August: -2.8%
September: -2.1%
Also, the rising dollar is creating headwinds for this entertainment giant. If DIS reports better-than-expected earnings, it may experience a fate similar to other multinational companies that recently have reported - gap higher, then sell off.
Key Earnings Reports
(actual vs. estimate):
DISH: .70 vs .72
JD: .11 vs .15
MCHP: 1.40 vs 1.35
(reports after close, estimate provided):
DIS: 1.68
EA: 1.15
LBTYA: .08
MAR: 1.25
MNST: .39
OXY: 1.71
PAA: .31
SLF: .88
Key Economic Reports
None
Happy trading!
Tom
