Market Recap for Thursday, May 31, 2018
The roller coaster ride of 2018 has suddenly re-emerged this week. After considerable weakness on Tuesday to open this holiday-shortened week, we saw a beautiful bounce-back rally on Wednesday. That felt pretty good from a bullish perspective.....until yesterday's renewed selling. But the fear meter - Volatility Index ($VIX) - barely budged higher given the selloff and that is an indication of a market willing to ignore poor headline news. The bulls can take a consolation prize, even on an otherwise bearish day. The other positive from Thursday's action is that leadership to the downside was once again from the defensive-oriented consumer staples sector (XLP, -1.60%).
I'm a big fan of momentum indicators, particularly the MACD and PPO. They measure momentum based on price and percentage differences, respectively, between exponential moving averages. There is a HUGE difference in my opinion, though, between improving momentum beneath a PPO centerline and improving momentum above it. In the consumer staples area, nondurable household products ($DJUSHN) was a perfect example of apparent improving momentum that you should totally ignore:
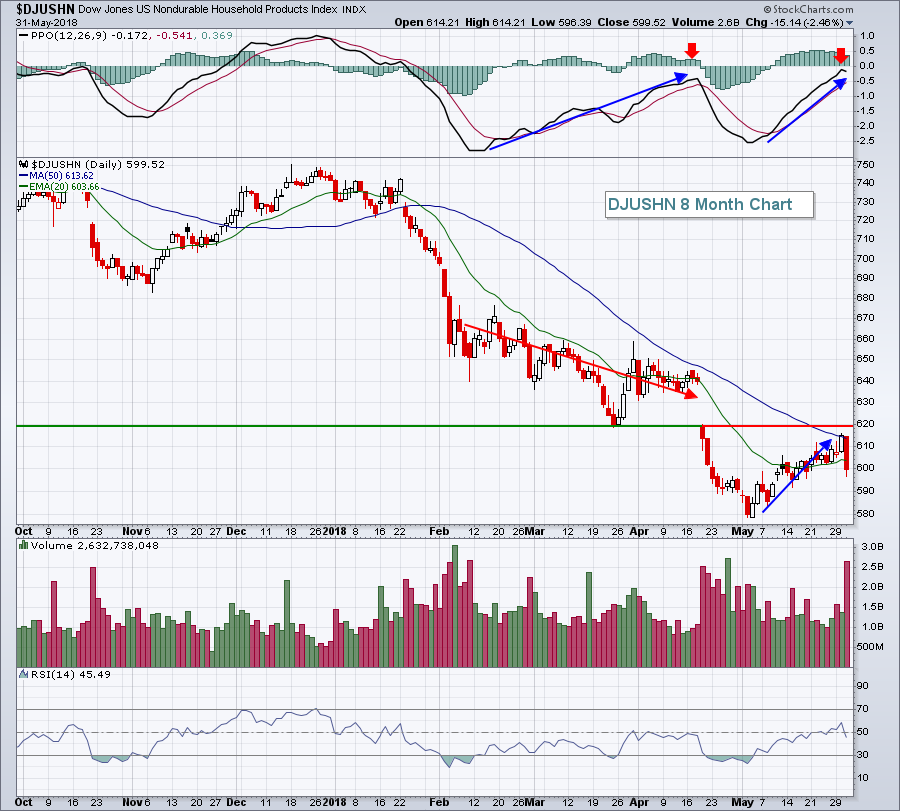 First, look at the improving PPO from the second week of February through mid-April. That would suggest that momentum has turned in a big way, but has it really? Look at the price action during that period. The downtrend continued. The PPO didn't tell us anything bullish. What it told us was that selling momentum was slowing, that the pace of the downtrend wasn't as much of a freefall. That's a far cry from accelerating and bullish price action. Over the past month, the price action on the DJUSHN did actually improve, but when it hit its 50 day SMA and neared both price resistance and its PPO centerline, the price turned lower yesterday in a big, big way.
Automobiles ($DJUSAU) gained more than 3% yesterday, getting a huge lift when Softbank Vision Fund announced a multibillion dollar investment in General Motor's (GM, +12.87%) driverless-car unit. While GM clearly benefited from the news and investment, Tesla (TSLA, -2.40%) did not.
Pre-Market Action
The May nonfarm payrolls report came in stronger than expected and the immediate reaction has been a selloff in bonds as the 10 year treasury yield ($TNX) is up 9 basis points to 2.92% just after the report. Dow Jones futures also have spiked, rising 116 points with less than 45 minutes left to the opening bell.
Current Outlook
The rapidly rising dollar ($USD) has sent money pouring into small caps relative to large caps, but the USD has hit a temporary wall of resistance at 95. First, take a look at the USD chart to recognize the battle unfolding:
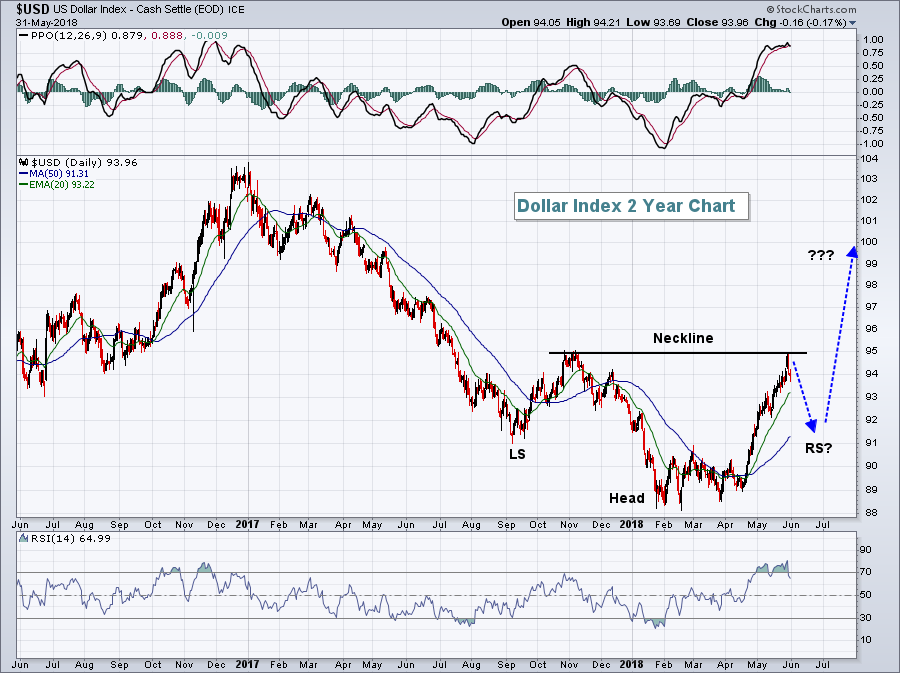 The more bearish short-term argument suggests price resistance will hold and the best case scenario would be a pullback to 91 or so to for an reverse right shoulder to print one final bottom. If this were to occur, we'd likely see a serious bout of large cap relative strength with the small cap Russell 2000 lagging on such dollar weakness. I'm not so sure this scenario develops, however, as the bigger picture view suggests this dollar rally is nowhere near close to over:
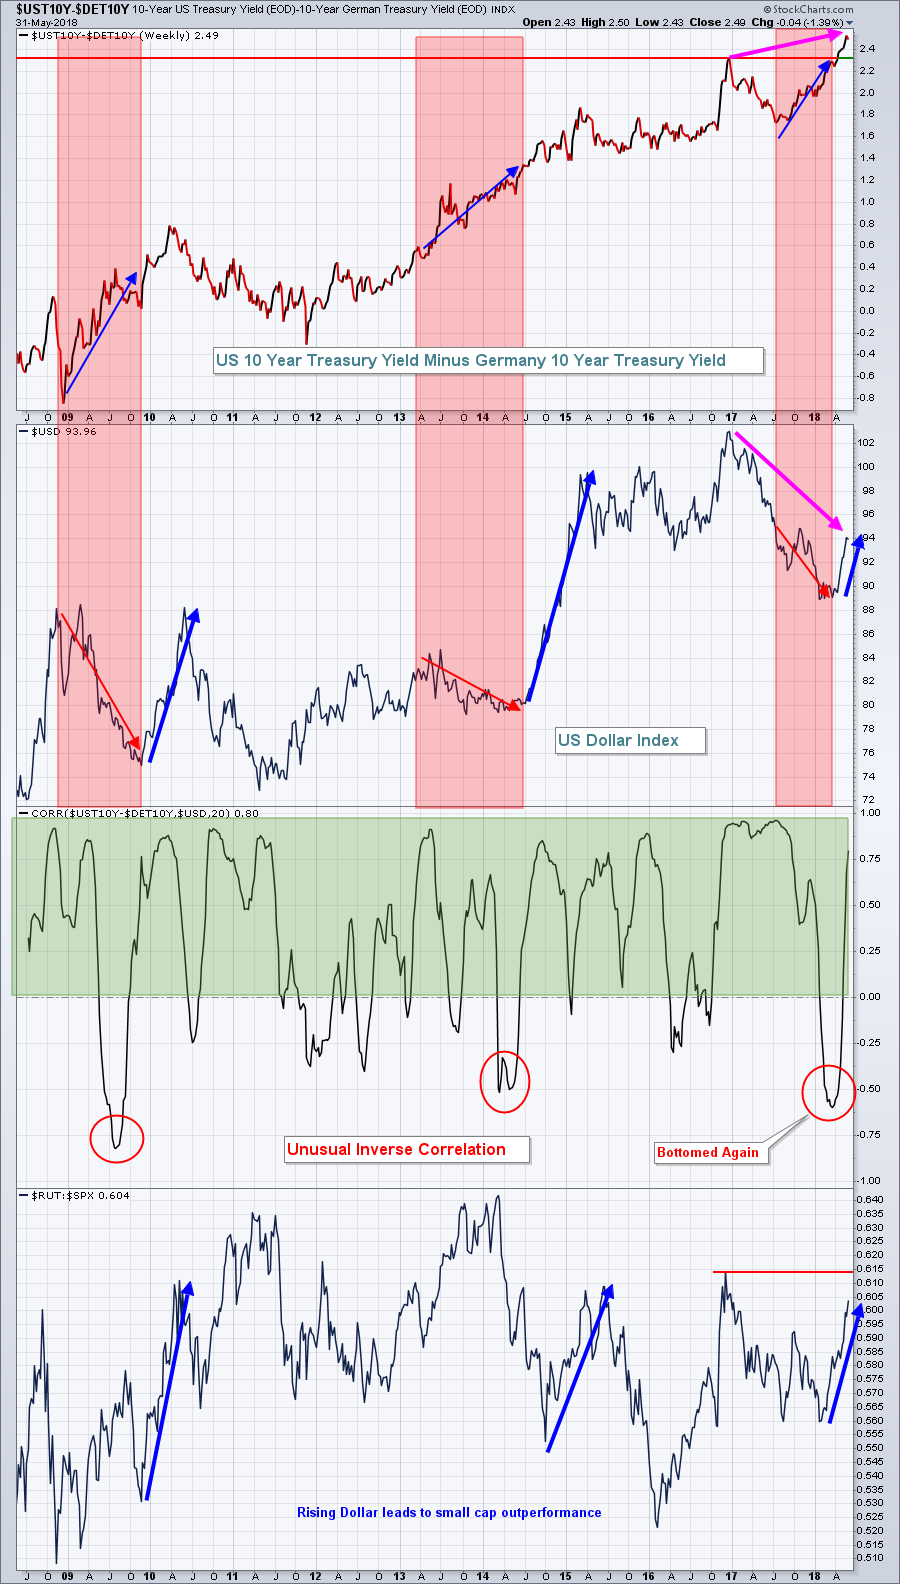 There's historically been a very tight positive correlation between (a) the difference in treasury yields between the U.S. and Germany and (b) the direction of the U.S. Dollar Index ($USD). After a recent period of inverse correlation (only the 3rd such period during this bull market in equities), the USD has surged to begin playing catch up. The key word here is begin. Those pink lines above show that the difference in treasury yields has broken out easily to new highs, but the USD remains far, far below its late-2016 high. This Big Picture view might suggest the USD will not see a deep reverse right shoulder, perhaps only a rising 20 day EMA test at best.
Sector/Industry Watch
The theme over the past few months has been small caps, small caps, SMALL CAPS! And the leader among small caps? Healthcare stocks without a doubt. The following chart shows the absolute and relative strength of the PowerShares S&P SmallCap Healthcare Portfolio (PSCH):
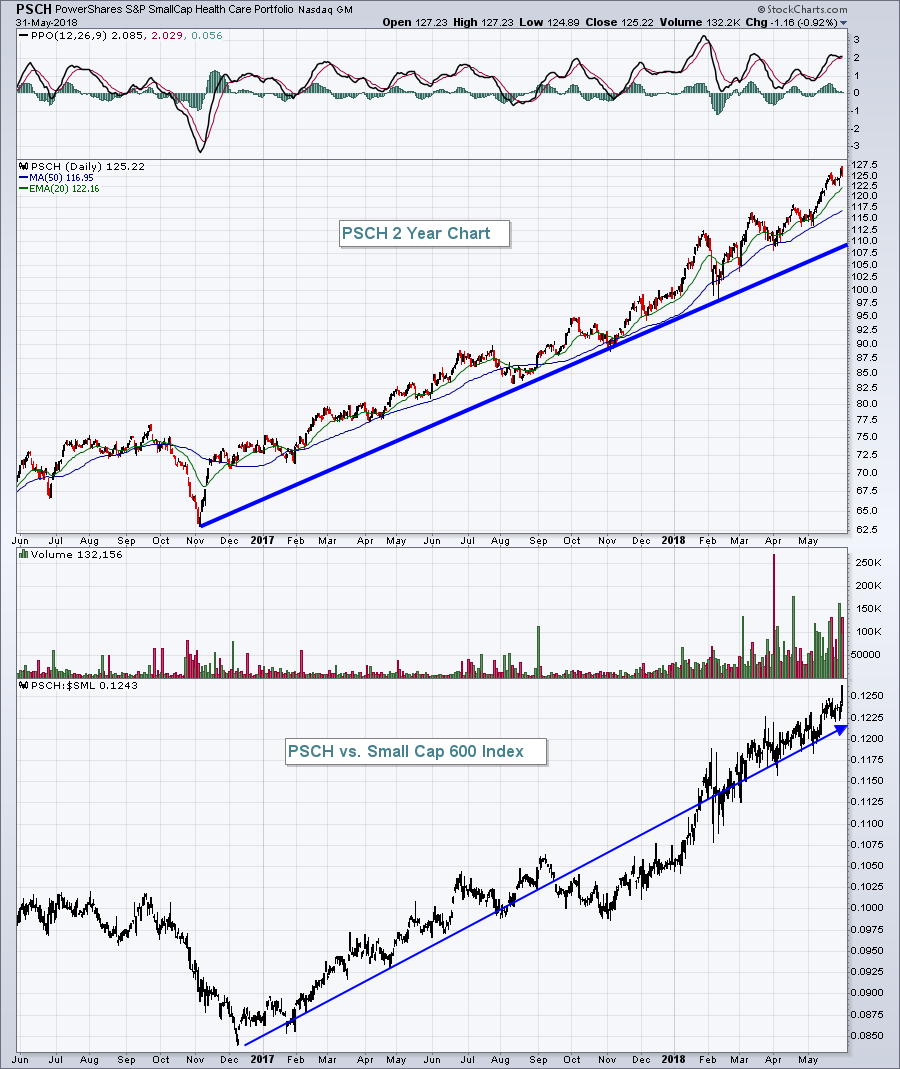 If the dollar pulls back temporarily and the PSCH follows suit to the downside, an opportunity would arise as PSCH moves closer to its uptrend line. While I don't expect selling to last long enough to actually reach the uptrend line, currently close to 110, a move beneath 120 to approach price support is a possibility.
Historical Tendencies
Over the past 20 years, June has delivered Russell 2000 relative strength (vs. the benchmark S&P 500) 16 times. It's been by far the best month for small cap relative strength, averaging monthly returns that are 1.5% higher than the S&P 500. As noted above in the Current Outlook, small caps have been on a relative roll the past few months and history says it's likely to continue for the next 30 days - at a minimum.
Key Earnings Reports
None
Key Economic Reports
May nonfarm payrolls released at 8:30am EST: 223,000 (actual) vs. 190,000 (estimate)
May private payrolls released at 8:30am EST: 218,000 (actual) vs. 184,000 (estimate)
May unemployment rate released at 8:30am EST: 3.8% (actual) vs. 3.9% (estimate)
May average hourly earnings released at 8:30am EST: +0.3% (actual) vs. +0.2% (estimate)
May PMI manufacturing index to be released at 9:45am EST: 56.6 (estimate)
May ISM manufacturing index to be released at 10:00am EST: 58.5 (estimate)
April construction spending to be released at 10:00am EST: +0.8% (estimate)
Happy trading!
Tom
