Special Note
I will be on a short mini-vacation beginning Friday, July 20th. Therefore, I will not be writing a Trading Places blog article that day. I will be back on Monday, however, with my latest recap and thoughts on the stock market. If you enjoy my blog, please subscribe at the bottom of this article by typing in your email address and clicking the green "Subscribe" button. You'll then receive my blog articles via email as soon as they're published! Thanks for your support and happy trading to all!
Market Recap for Tuesday, July 17, 2018
It was a wild day on Wall Street. The NASDAQ opened on a very sour note, down approximately 50 points, as its strongest component of the last five years - Netflix (NFLX, -5.24%) - dropped a bomb by missing revenue and subscriber estimates. It didn't stop there as NFLX reduced its Q3 guidance. As you might expect, NFLX tumbled 54 points, or 13%, at the opening bell. It didn't take long for traders to begin scooping up discounted shares on this specialty retailer, however, and by day's end NFLX had closed just 5% lower. The NASDAQ's initial 50 point drop didn't last either. The NASDAQ finished nearly 50 points higher on the session, posting the largest gain of all our major indices. There probably weren't many who thought that might happen given the start of the day. The stock market loves the three week periods (which I consider to be the 28th of the calendar month preceding the start of earnings season to the 18th of the calendar month hosting the start of earnings season) leading up to earnings. More on that in the Historical Tendencies section below.
All of our major indices finished higher, led throughout most of the day by the Russell 2000's leadership. That broke a 5 day relative winning streak for the large cap S&P 500 vs. the small cap Russell 2000 and could be setting up further small cap relative strength, especially if the U.S. Dollar Index ($USD) can break convincingly above the 95 level, clearing important neckline resistance.
In an odd twist, materials (XLB, +1.31%) led Wall Street's rebound. The XLB is at or near the bottom of the sector leaderboard across nearly every time frame, including one week, one month, three months, six months and one year. The group has struggled with both a rising dollar and trade war fears, similar to industrials (XLI, +0.39%). Specialty chemicals ($DJUSCX, +1.66%) have performed relatively well amongst its materials peers and yesterday's strength has the DJUSCX close to a key breakout:
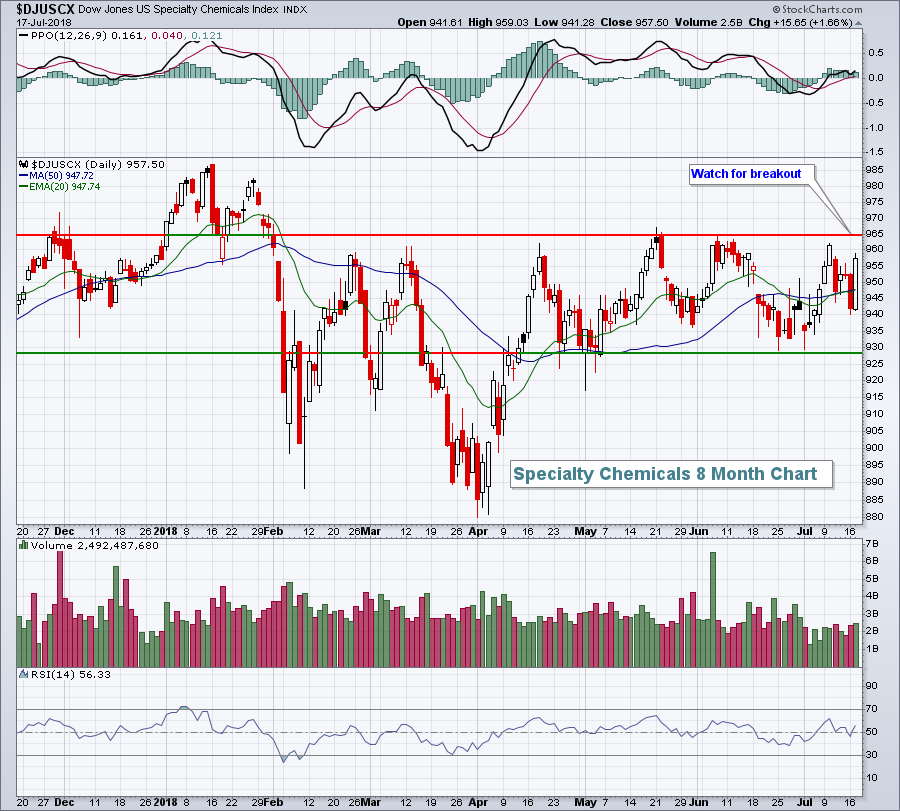 The DJUSCX has been mired for the past three months in a 928-965 trading range. A breakout would be bullish for many of its component stocks, especially the one featured below in the Sector/Industy Watch section.
Pre-Market Action
Crude oil ($WTIC) continues its recent slump, dropping beneath $68 per barrel this morning. Gold ($GOLD) is falling again as well, this time down $3 per ounce after falling 1%, or $12 per ounce, yesterday. U.S. futures are relatively flat as mostly positive earnings surprises continue to pour in.
Current Outlook
While the stock market tends to perform well leading up to earnings season, there tends to be some profit taking after earnings season begins. It tends to be a "buy on the rumor, sell on the news" type of event. While it doesn't always happen that way, the numbers do support this theory. Here are the past few quarters:
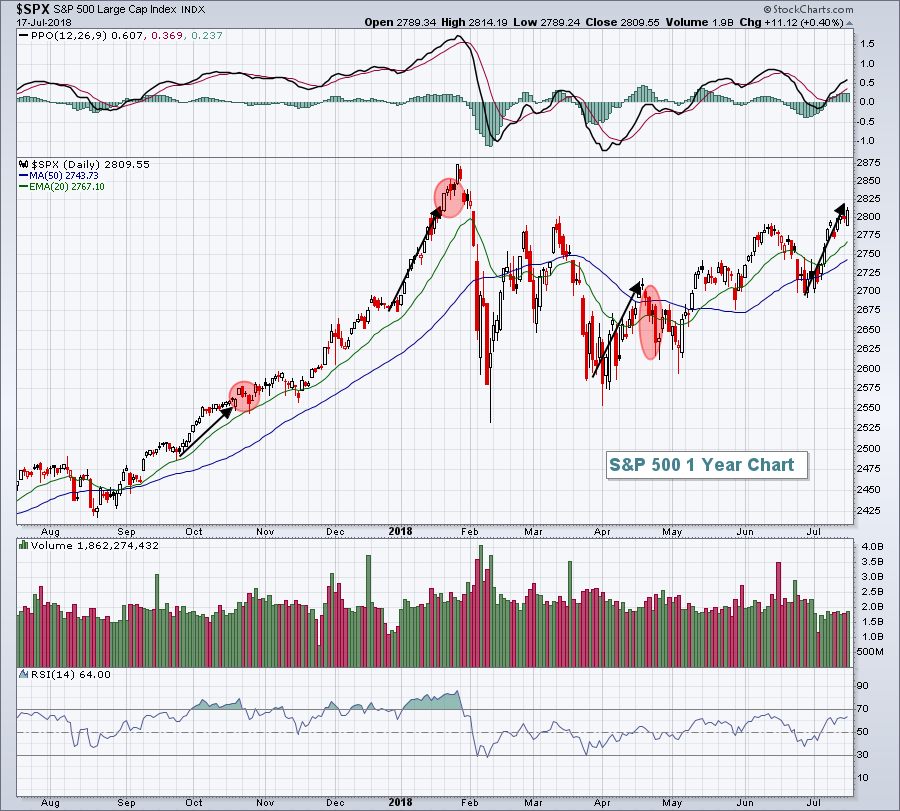 The black directional arrows highlight the performance of the S&P 500 over the past four quarters as we've headed into earnings season. Each has seen a significant rally. After these pre-earnings runups, however, the results have been mixed the following week. In January's euphoric rally, the strength continued. But that was not the case in the other two quarters. Of course, what happens over the next week remains to be seen, but it's not unusual to see some profit taking and consolidation.
Sector/Industry Watch
Cabot Corp (CBT) is a large cap stock within the specialty chemicals index ($DJUSCX) that was discussed in the Market Recap section. While the DJUSCX is still searching for its breakout, CBT already pushed through neckline resistance and now measures higher to roughly 77. Here's the chart highlighting its bullish inverse head & shoulders breakout:
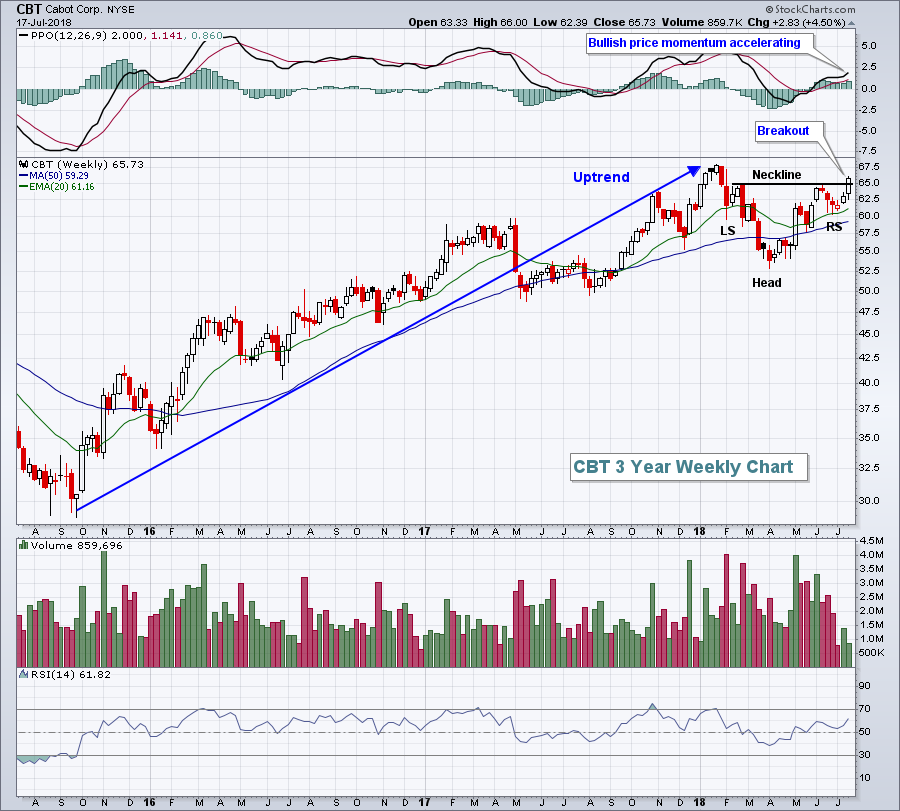
Since patterns can and do fall apart from time to time, I would be fine holding CBT so long as the recent inverse right shoulder holds in that 60-61 range with my target being 77.
Historical Tendencies
The S&P 500 has advanced 100 points over the past three weeks. Are you surprised? I'm not. It's the history of the stock market. Stock prices advance ahead of earnings season. Let's look at the annualized return of the S&P 500 since 1950 in the three weeks heading into the start of earnings season:
March 28th through April 18th (pre-Q1 earnings advance): +21.81%
June 28th through July 18th: +21.95%
September 28th through October 18th: +12.05%
December 28th through January 18th: +14.95%
Consider that the S&P 500 has produced average annual returns of roughly 9% over the past seven decades. The pre-earnings advances above have each easily cleared that historical 9% level and the April and July pre-earnings advances have more than doubled that historical 9% annual return.
Key Earnings Reports
(actual vs. estimate):
ABT: .73 vs .71
ASML: 1.63 vs 1.43
ERIC: (.01) vs .02
GWW: 4.37 vs 3.78
MS: 1.30 vs 1.08
MTB: 3.29 vs 3.17
NTRS: 1.72 vs 1.63
NVS: 1.26 vs 1.27
TXT: .87 vs .70
USB: 1.02 vs 1.01
(reports after close, estimate provided):
AXP: 1.83
CCI: 1.33
CP: 2.40
EBAY: .51
IBM: 3.03
KMI: .19
PTC: .32
URI: 3.50
Key Economic Reports
June housing starts released at 8:30am EST: 1,173,000 (actual) vs. 1,320,000 (estimate)
June building permits released at 8:30am EST: 1,273,000 (actual) vs. 1,329,000 (estimate)
Beige book released at 2:00pm EST
Happy trading!
Tom
