Market Recap for Tuesday, July 3, 2018
U.S. equities started the holiday-abbreviated trading session on Tuesday quite nicely with gains across each of our major indices. But that strength deteriorated throughout the day and, by the close, all but the small cap Russell 2000 had finished in negative territory. The Dow Jones remains above its key price support from the first half of 2018, but also continues to fail at overhead 20 day EMA in the short-term:
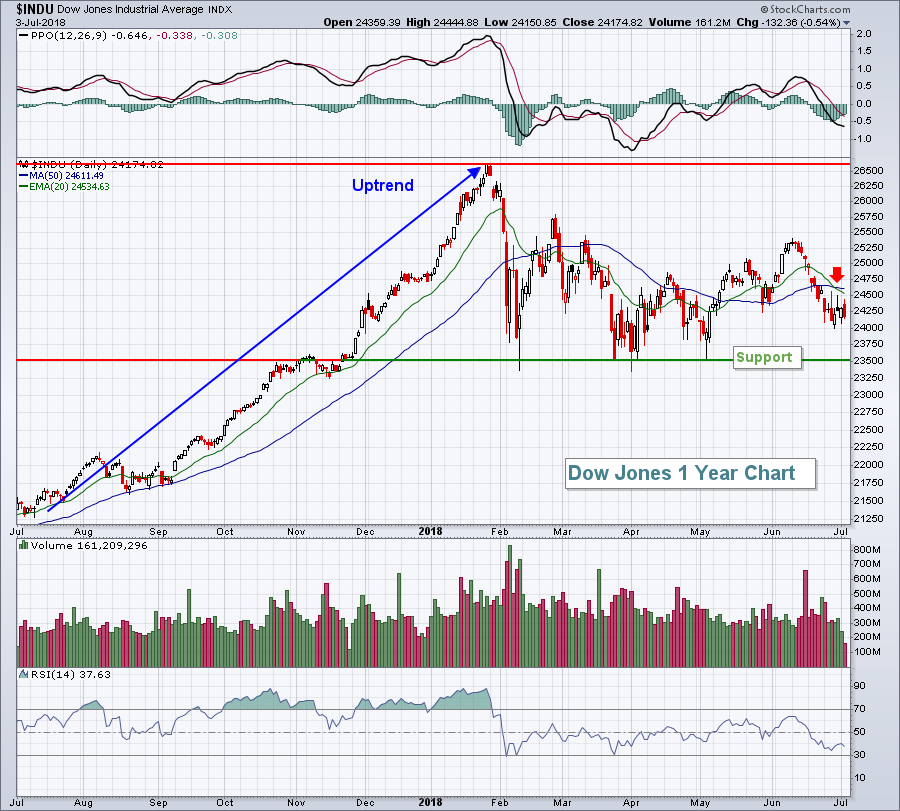 The red arrow points to a "death cross" where we've seen the 20 day EMA drop below its 50 day SMA. During periods of consolidation, this isn't so vital as it's the third time these two moving averages have crossed in 2018. It's impossible, however, to resume an uptrend with the 20 day EMA beneath the 50 day SMA. So the first step for the Dow Jones will be to clear its 20 day EMA and then begin to use it as support during pullbacks. Until that occurs, expect further lagging from this index of multinational conglomerates.
Energy (XLE, +0.63%) led all sectors on Tuesday after crude oil ($WTIC) briefly moved above $75 per barrel. It then fell back beneath $73 before settling back just above $74. While the session was volatile for oil, the XLE is responding to the $10 per barrel surge in crude over the past two weeks. Technology (XLK, -1.18%) was dragged down by Facebook (FB) as The Washington Post reported that the Fed's investigation of FB's data sharing practices is expanding. Internet stocks ($DJUSNS, -2.14%) were roughed up on the news with FB, Alphabet (GOOGL) and Twitter (TWTR) all down more than 2%.
Pre-Market Action
The June ADP employment report was released this morning and it came in 13,000 below consensus estimates. However, the May number was revised 11,000 higher. Dow Jones futures were strong before the news release and continued to be after the news. Initial jobless claims rose a bit to 231,000, but failed to generate much of a response. The 10 year treasury yield ($TNX), continuing to languish beneath its 20 day EMA, moved slightly higher to 2.86%.
Crude oil ($WTIC) is up fractionally to $74.45 per barrel. Gold ($GOLD) is up slightly to $1255 per ounce. Asian markets finished lower overnight as anticipation of trade tariffs weighed. European markets are much higher today with the German DAX ($DAX) leading, up 176 points (+1.43%). U.S. stocks appear to be taking their cue from Europe as Dow Jones futures are up nearly 200 points with about 50 minutes to go to today's opening bell.
Current Outlook
Despite the fact that the U.S. Dollar Index ($USD) has failed to negotiate overhead price resistance, the relative performance of small caps appears to be accelerating again, perhaps in anticipation of that dollar breakout. Neither has broken out just yet, but the following is the latest technical picture of both:
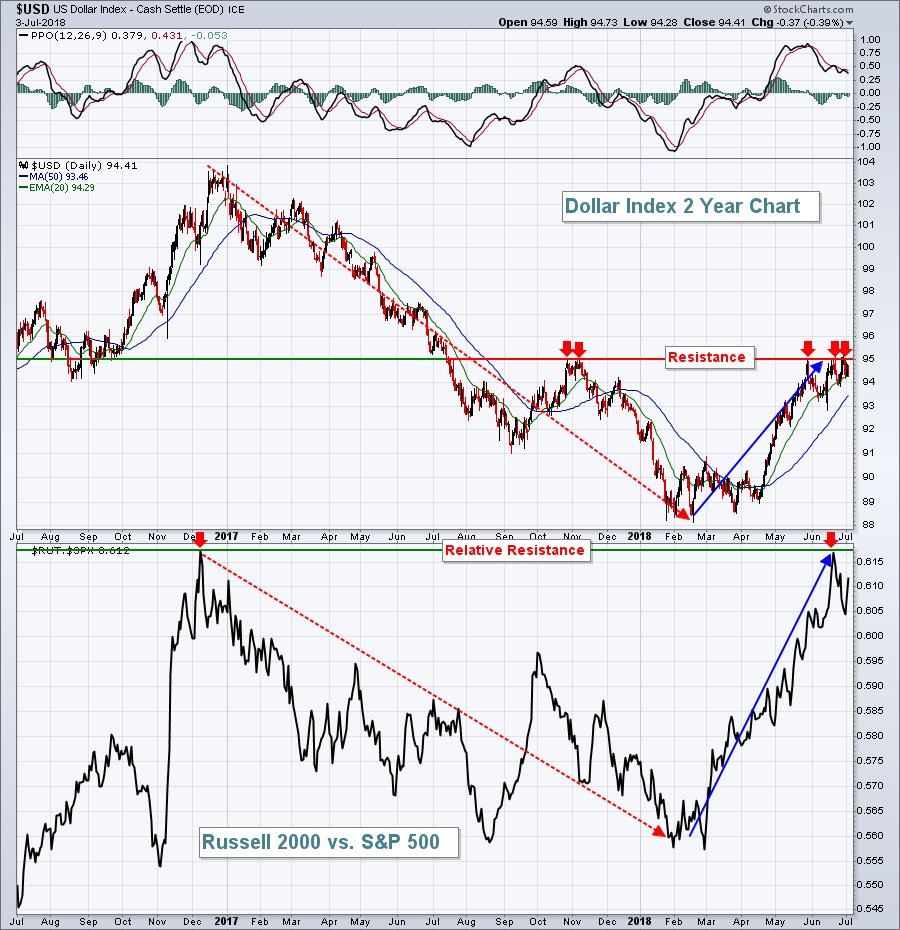 You can see from the above chart how important it is to understand the direction of the USD. It has major implications on how you want to weight your portfolio. A breakout in the USD above 95 resistance would suggest continuation of the small caps relative dominance in 2018.
Sector/Industry Watch
The Dow Jones U.S. Tires Index ($DJUSTR) was the worst performing industry group during the first half of 2018, falling 26%. There is good news, however, as the DJUSTR is rapidly approaching perhaps its most significant price support level on its 10 year weekly chart:
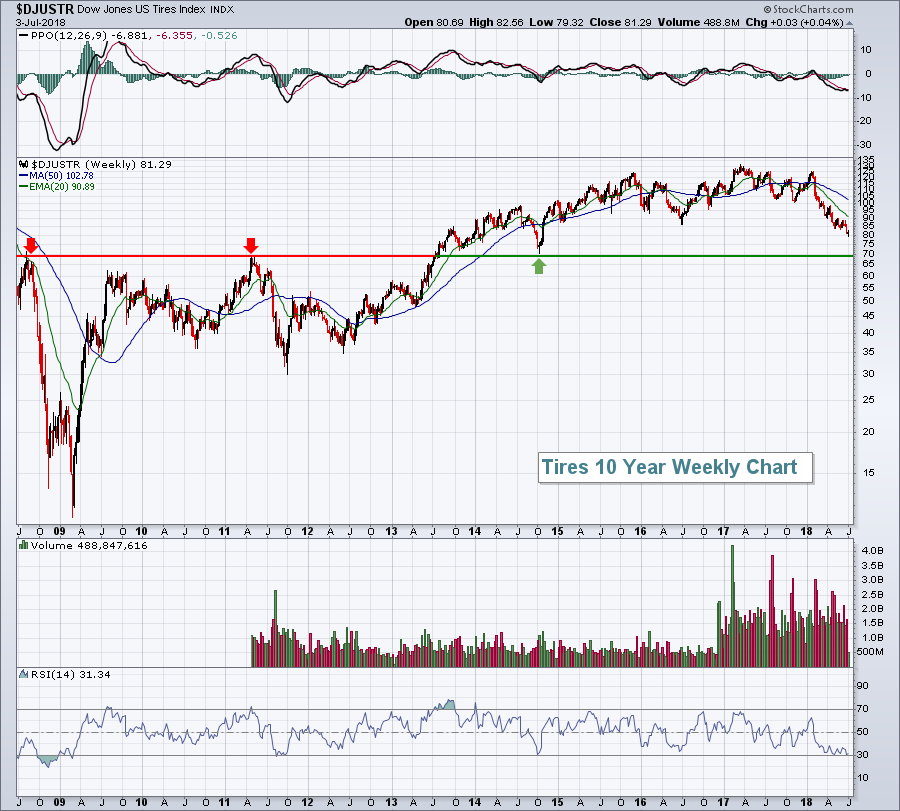 I'm a momentum trader and the weekly PPO continues to push lower, so it doesn't appear the group is quite ready for a sustained upside move. But for those seeking value and willing to wait awhile, a stock like Goodyear Tire & Rubber (GT) might make some sense. Selling volume appears to be slowing a bit and GT does pay a 2.27% dividend, just slightly below the 10 year treasury yield, and their dividend has been rising rapidly - more than 40% each of the last two years.
Historical Tendencies
On the NASDAQ and since 1971, the 11th through the 17th has been the best period in July. During this 7 day stretch, the NASDAQ has produced annualized returns of +61.63%. The worst period in July has been July 18th through the 24th where the NASDAQ has produced annualized returns of -41.76%.
Key Earnings Reports
None
Key Economic Reports
June ADP employment report released at 8:15am EST: 177,000 (actual) vs. 190,000 (estimate)
Initial jobless claims released at 8:30am EST: 231,000 (actual) vs. 223,000 (estimate)
June PMI services index to be released at 9:45am EST: 56.5 (estimate)
June ISM non-manufacturing index to be released at 10:00am EST: 58.4 (estimate)
Happy trading!
Tom
