Market Recap for Tuesday, August 7, 2018
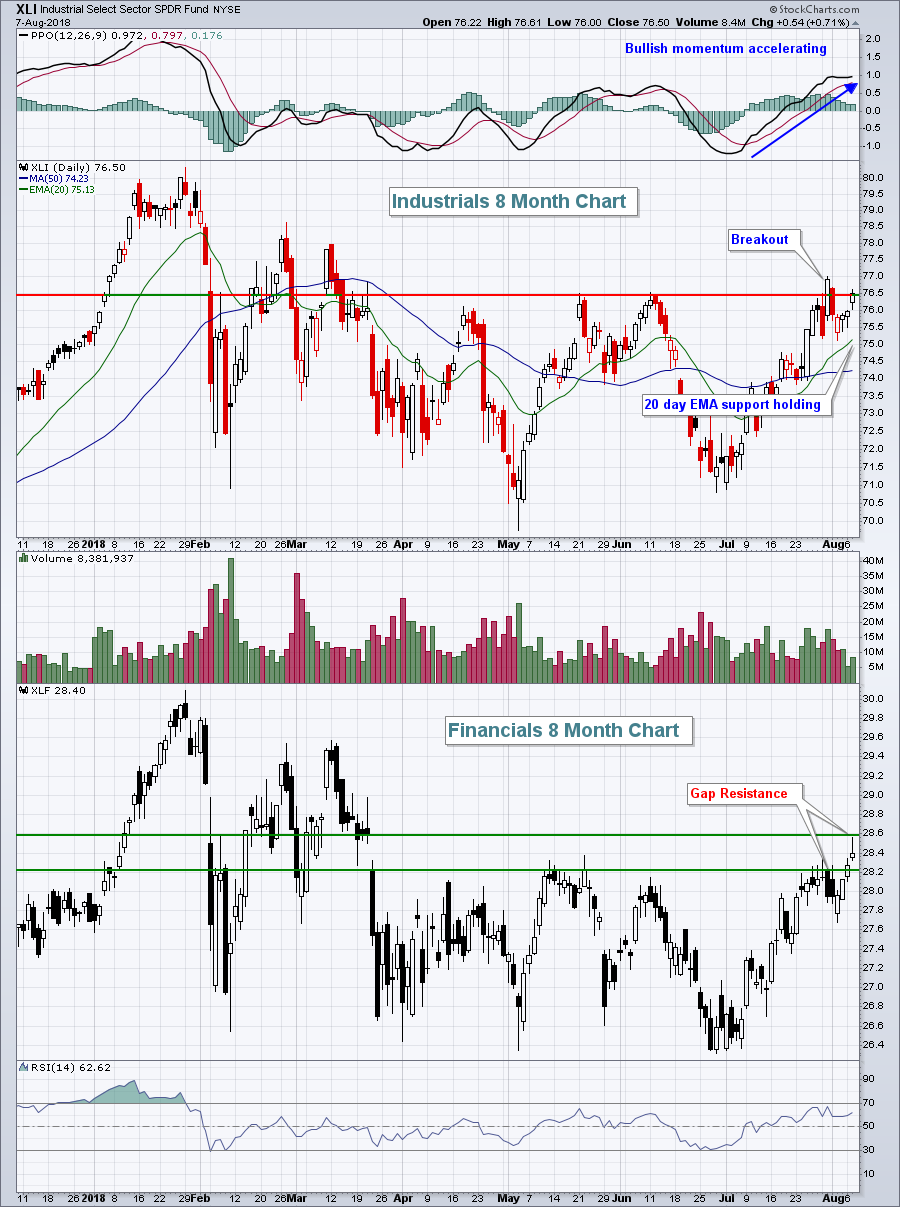
It was another nice rally on Wall Street, led by energy (XLE, +0.74%) and industrials (XLI, +0.71%). Since the beginning of July, we've seen renewed strength in larger cap stocks. Industials, along with financials (XLF, +0.46%) have been the biggest beneficiaries of that theme change. The XLI broke out to a multi-month high last week and the XLF is now doing the same thing:
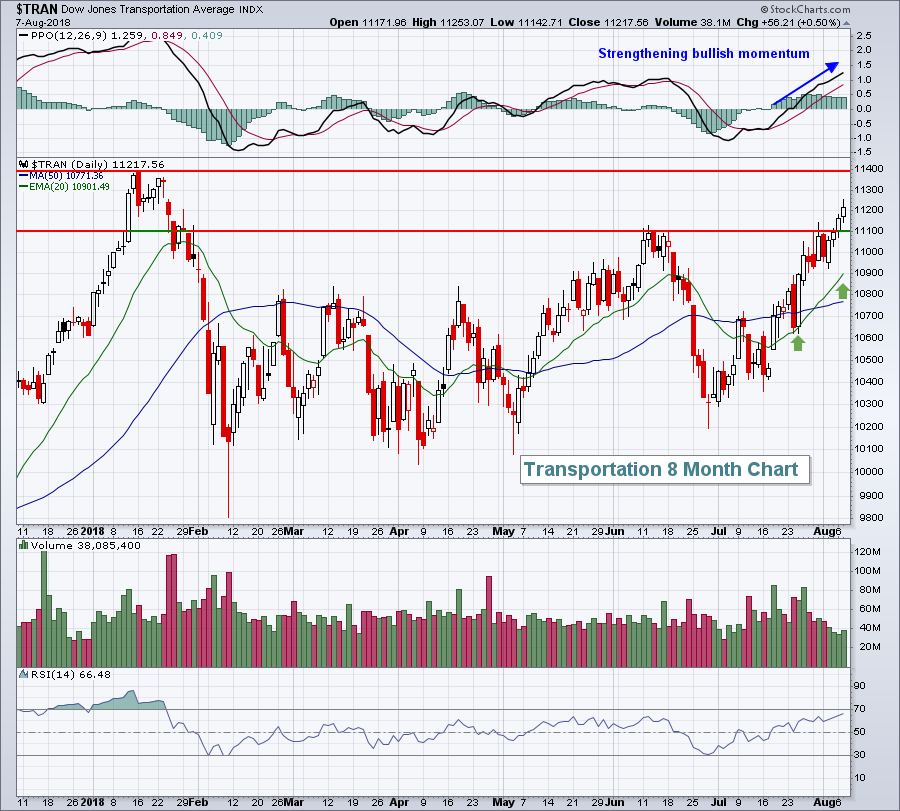
 Transports ($TRAN) are certainly aiding the industrials sector as they've cleared June resistance and looking to the all-time high, set back in January:
 Traders shied away from defensive stocks as sector laggards included consumer staples (XLP, -0.61%) and utilities (XLU, -0.15%). Soft drinks ($DJUSSD) were weak yesterday, holding back the staples stocks and a negative divergence could spell additional short-term trouble ahead:
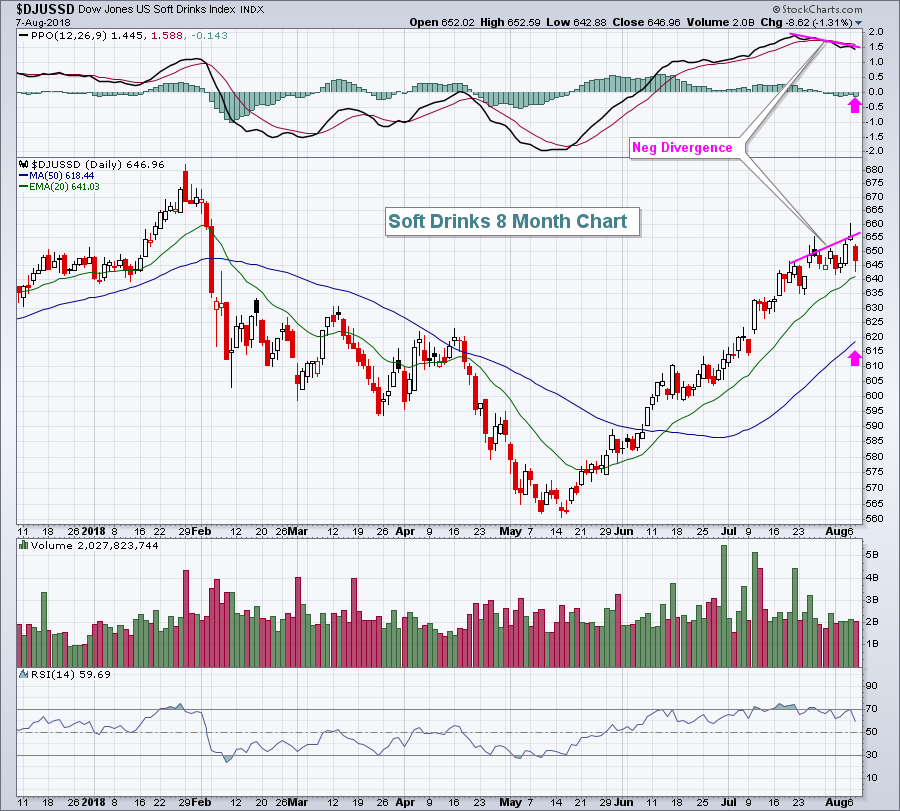 Monster Beverage Corp (MNST) reports its latest quarterly results after the closing bell today and likely holds the short-term key for the group. If the reaction to their report is negative, I'd look for 50 day SMA/PPO centerline tests (pink arrows) in the days ahead. From that point, the reward to risk in the group would be quite strong.
Pre-Market Action
Crude oil prices ($WTIC) are down 1.45% to just above the $68 per barrel level. Global markets were mixed overnight and this morning and that's led to a bit of weakness here in the U.S. Dow Jones futures are down 30 points with a little less than 30 minutes left to the opening bell.
Walt Disney Co (DIS) reported its quarterly results last night after the closing bell. DIS missed estimates but had a rather upbeat outlook in terms of its content lineup. DIS is down slightly in pre-market and it's been very strong lately from a technical perspective. Therefore, I'd look for buyers to appear if DIS hits its 20 day EMA, currently at 111.86.
Current Outlook
Money has begun rotating back into aggressive areas of the market, so I'll be watching to see how the NASDAQ performs. On an hourly chart, resistance is clearly defined at 7932, the all-time closing high on July 25th. To the downside, the recent strength has resulted in a rapidly-ascending 20 hour EMA that has not been tested since it was cleared last week:
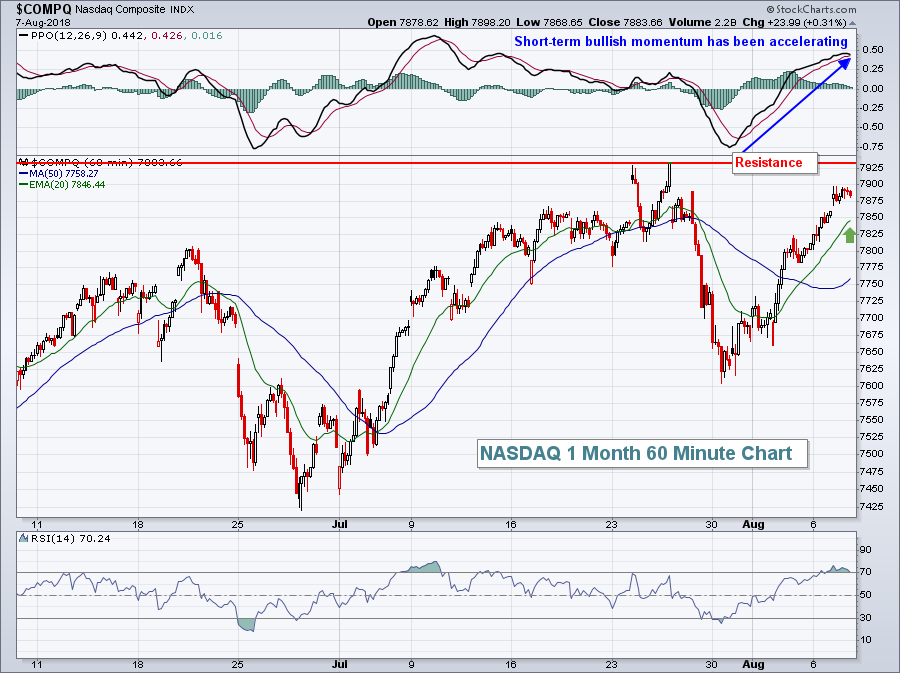 Futures are down this morning. I'd watch for buying interest in the 7850-7860 area on the NASDAQ if we move down that far.
Sector/Industry Watch
I mentioned above that the financials have broken out and that large caps were the primary beneficiaries and that was true. However, the U.S. Dollar Index ($USD) has been pausing and that's taken away the small cap financial leadership recently. I fully expect the USD to move higher in the next several months. If I'm right, look for small cap financials to break out of their current bullish ascending triangle pattern and lead their larger cap counterparts:
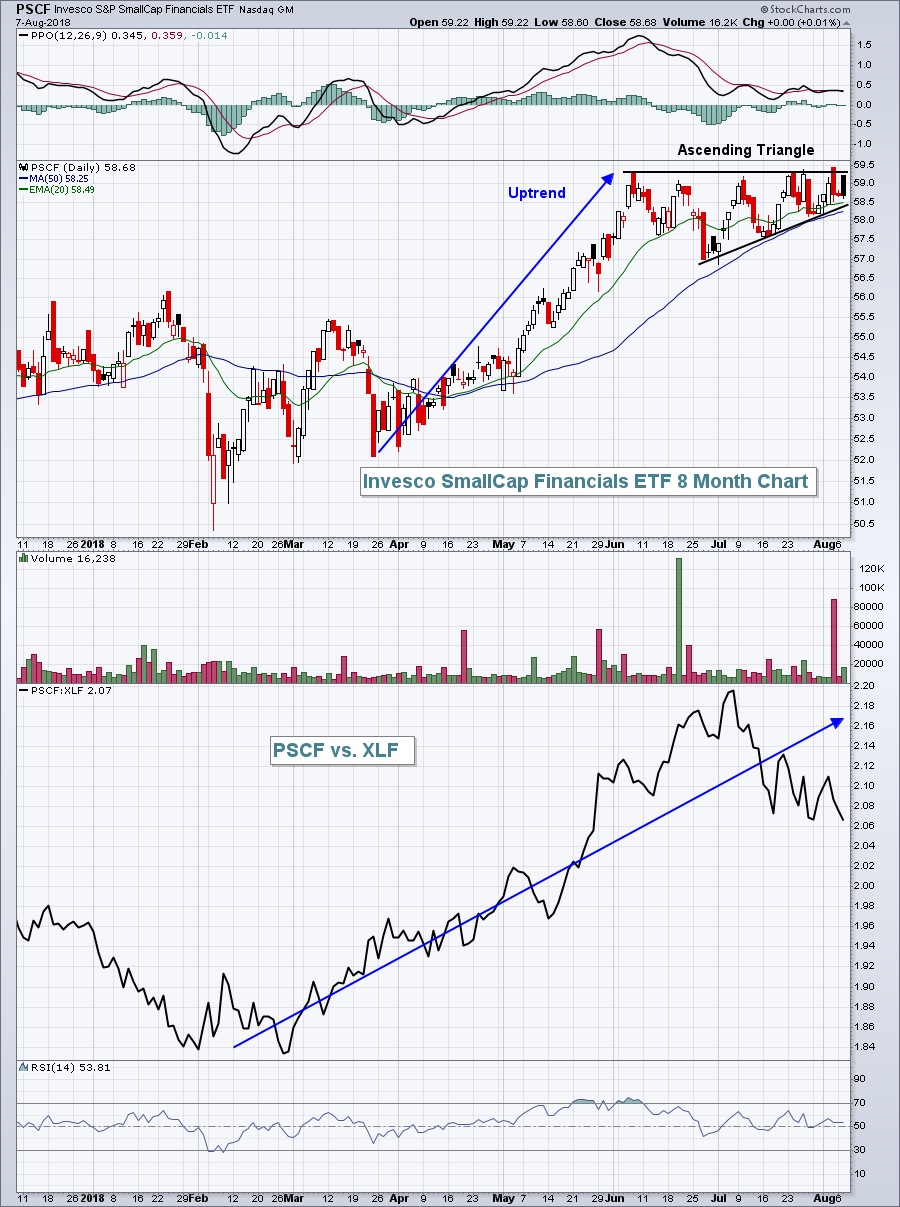 A breakout to fresh highs in the PSCF would have an initial target of 62 based on the ascending triangle pattern and measurement. I am very bullish the small cap financials right now given their bullish pattern and the likelihood of an advancing dollar.
Historical Tendencies
The Dow Jones U.S. Steel Index ($DJUSST) currently resides at trendline support if you connect lows from March and early-July. It also just tested its 200 day SMA for the second time in five weeks. Be careful if support is lost in steel because the group has a poor track record in August historically. The DJUSST has gained ground only 21% of Augusts over the past two decades and has averaged losing 3.1% during the month over the time frame.
Key Earnings Reports
(actual vs. estimate):
CVS: 1.69 vs 1.61
MGA: 1.67 vs 1.71
MYL: 1.07 vs 1.23
SO: .80 vs .69
TRI: .17 vs .11
WB: .68 vs .67
(reports after close, estimate provided):
BAP: 3.98
BKNG: 17.44
CTL: .23
EQIX: 5.06
ETE: .46
ETP: .17
FOXA: .54
LBTYA: .12
MELI: (.21)
MFC: .49
MNST: .47
NTES: 2.42
OXY: 1.25
SLF: .88
Key Economic Reports
None
Happy trading!
Tom
