Market Recap for Friday, September 21, 2018
Bifurcation was once again apparent on Wall Street to close out last week. The Dow Jones was able to finish higher and extend its trek into record high territory, while the S&P 500 was essentially flat. The NASDAQ and Russell 2000, however, were met with sellers and both closed down fairly significantly - 0.51% and 0.46%, respectively.
The problem, clearly, was that three aggressive sectors struggled simultaneously. Consumer discretionary (XLY, -0.44%), technology (XLK, -0.39%) and financials (XLF, -0.39%) led to the downside with notable industry weakness in internet stocks ($DJUSNS, -1.77%):
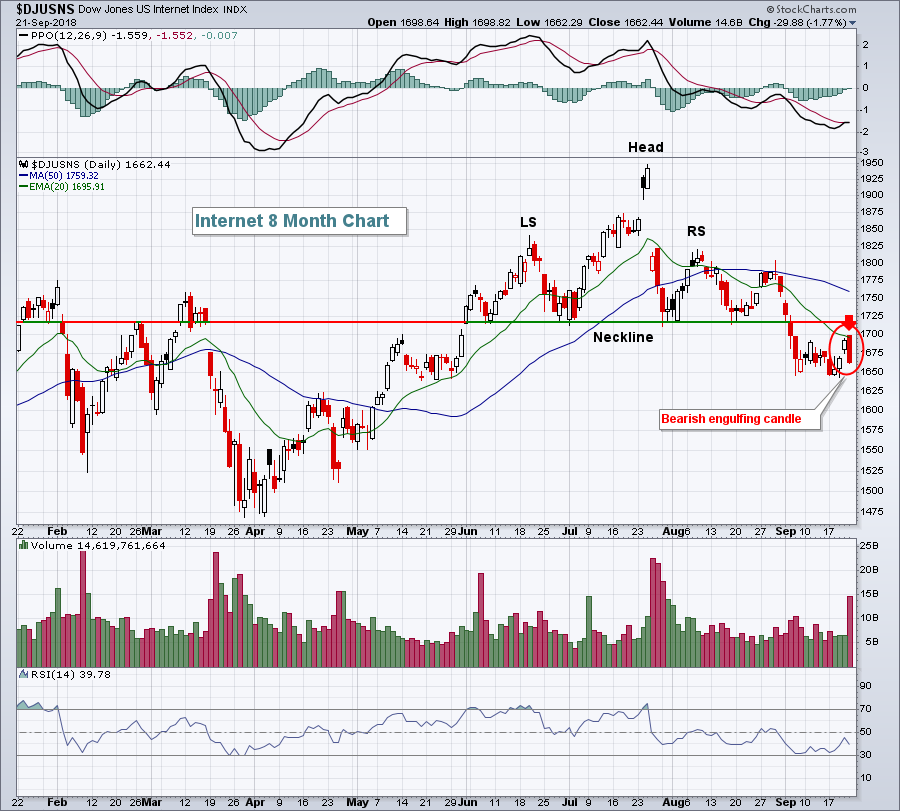 If there's a group poised to move lower, this is it. A breakdown from a head & shoulders topping pattern, followed by a rebound to 20 day EMA resistance and then a bearish engulfing candle to mark a short-term top. I'm looking for the DJUSNS to break back below early September lows.
The Dow Jones was able to extend further into record territory with support from energy (XLE, +0.66%) and industrials (XLI, +0.65%).
Pre-Market Action
The U.S. Dollar ($USD) is mixed against foreign currencies and gold ($GOLD) continues to hover near the $1200 per ounce threshold. Crude oil ($WTIC) is up 1.41% and approaching $72 per barrel.
The China Shanghai Composite ($SSEC) gained 2.5% overnight as the "rumors" have ended and the "news" of China-U.S. tariffs begin to kick in. European markets are fractionally lower this morning.
Dow Jones futures are currently lower by 34 points as its 4 day winning streak is tested to begin a fresh new week.
In merger news, SiriusXM (SIRI) is buying Pandora (P) in an all stock deal valued at $3.5 billion.
Current Outlook
The NASDAQ has been weak relative to both the Dow Jones and S&P 500 and that could continue so long as the index is range bound:
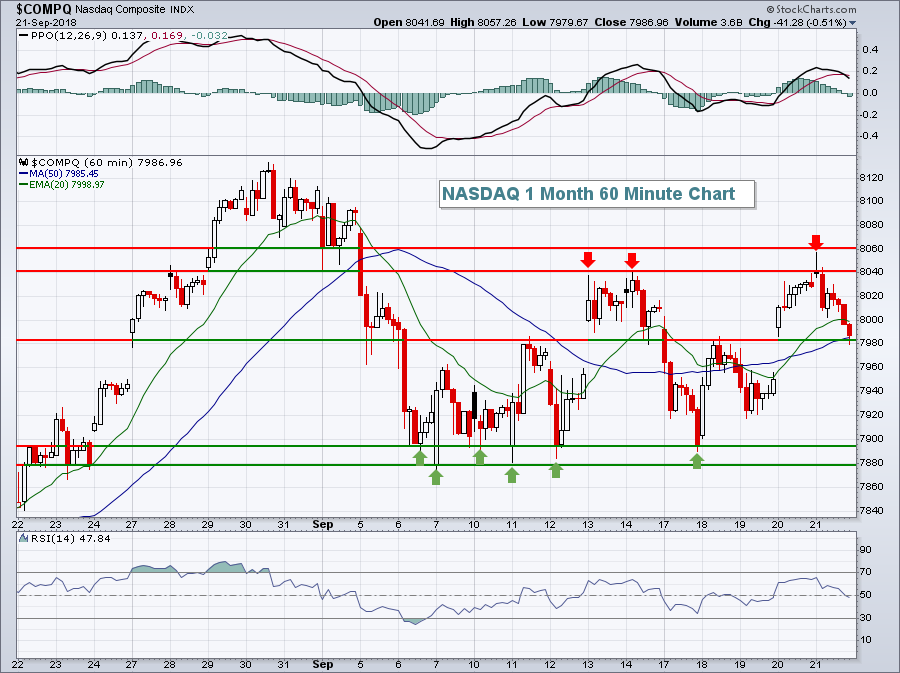 I wouldn't look for money to significantly rotate towards the tech-laden NASDAQ until the 8060 price resistance level breaks. In the meantime, watch short-term price support in the 7880-7900 zone. I fully expect to see NASDAQ stocks have a run higher into Q4 earnings, which start in a few weeks. One more test of the support zone, however, cannot be ruled out.
Keep in mind that the 50 day SMA is currently at 7892 (not shown on hourly chart above). But it's important to realize that if support on this hourly chart is lost, the NASDAQ will also be losing its 50 day SMA support as well. The NASDAQ barely closed beneath that key moving average on July 30th and that was the only time we've seen that since early May. I believe we'll hold this support zone, but I'll definitely need to re-evaluate if I'm wrong.
Sector/Industry Watch
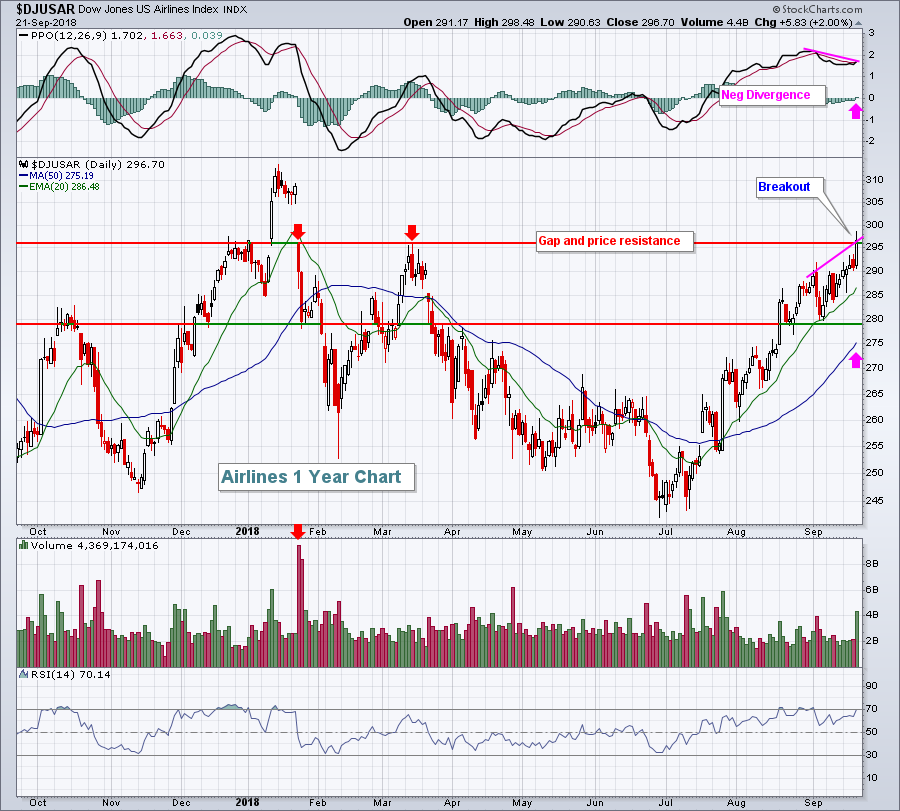
The Dow Jones U.S. Airlines Index ($DJUSAR) has been on fire of late and that strength was apparent on Friday as the group closed at its highest level since gapping down on very heavy volume in January 2018:
 Volume was heavy on Friday, but it was quad-witching day, which is when market index futures, market index options, stock options and stock futures all expire simultaneously. It occurs the 3rd Friday of March, June, September and December every year. I tend to ignore volume on quad witching days because the volume will be there regardless of technical conditions. In other words, it's not necessarily an indication of accumulation or distribution.
Instead, I'd focus on three things with airlines. First, Friday represented the highest close since January. Second, this 8 month high close in price is accompanied by a negative divergence. Finally, we're approaching the best time of the year seasonally for airlines stocks (see Historical Tendencies section below). The high volume breakout would normally negate the negative divergence in my view. After all, how can you come to the conclusion that momentum is slowing (which is what a negative divergence suggests) when price is moving higher on expanding volume? That reeks of accumulation, the opposite of slowing momentum. But it was quad-witching day and volume is exaggerated. So what should we glean from all of this? Well, if you look at the action since early July, you'll see the DJUSAR is in a serious uptrend. I don't fight uptrends, especially in a bull market. But the pink arrows above mark possible PPO centerline and 50 day SMA tests that can result from a negative divergence. A reversing candle near this gap resistance level close to 295 would signal an increased likelihood of such tests.
Monday Setups
This week I'm going with a stock that's really been beaten up since its much-better-than-expected earnings report was released. La Z Boy, Inc (LZB) on August 21st released revenues of $384.7 million, well above the consensus estimate of $367.1 million. Its bottom line came in at $.39, a huge beat as Wall Street was only looking for $.25 per share. LZB gapped much higher when trading opened, from 33 to nearly 39, but it quickly retreated and now seems to be running out of short-term sellers in the 31.50-33.00:
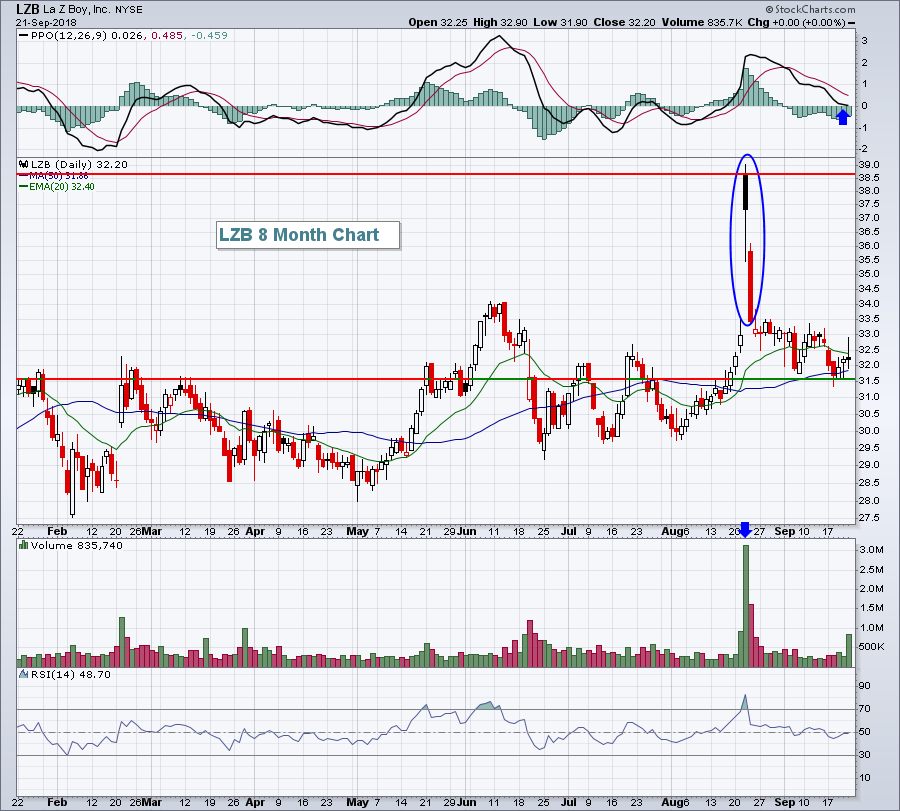 The selling after the initial burst higher is concerning, so I'd keep my stop in place beneath the recent low. A close below 31.50 would have me out of the stock. But I wouldn't at all be surprised to see LZB make another run for 39. One positive not reflected on the above chart is that last week's selling tested LZB's rising 20 week EMA and the stock bounced, a bullish development.
For all of my Monday Setups this week, CLICK HERE.
Historical Tendencies
The Dow Jones U.S. Airlines Index ($DJUSAR) has averaged gaining roughly 9% per year over the past 19 years. But the 4th quarter has produced average gains of nearly 14% the past 19 years. The gains are even more pronounced in recent years. Since 2012, the DJUSAR has averaged gaining 20.7% in the 4th quarter alone.
Key Earnings Reports
None
Key Economic Reports
None
Happy trading!
Tom
