Subscribe For FREE Below
If you enjoy my daily blog article that summarizes recent action, current outlook and provides a historical perspective, please subscribe below. It's 100% FREE, no strings attached, and is much appreciated. Simply scroll to the bottom of my article and type in your email address in the space provided and click the green "Subscribe" button. The benefit? My article will be sent to the email address provided the moment it's published. :-)
Do the same for my colleagues here at StockCharts.com and get the best technical information on the internet delivered directly to your inbox! Thanks so much and happy trading!
Finally, if you ever have any comments on my articles or would like to see additional information, feel free to send me your comments to tomb@stockcharts.com.
Market Recap for Monday, October 22, 2018
The good news yesterday is that key aggressive sectors - technology (XLK, +0.83%) and consumer discretionary (XLY, +0.40%) - were on top of the sector leaderboard, aiding the NASDAQ 100 ($NDX, +0.26%) as it outperformed the other major indices. The Dow Jones and S&P 500 fell 0.50% and 0.43%, respectively. But the real difference wasn't the XLK or the XLY. It was the XLF (financials ETF), which dropped 2.14% to close at its lowest level in 2018. (More on the XLF in the Sector/Industry Watch section below.)
The real difference was that the NDX doesn't have representation from financial stocks, other than financial administration ($DJUSFA, +0.32%), which managed to end the session in positive territory. Even the best performing industry group within technology yesterday - software ($DJUSSW, +1.12%) - is broken:
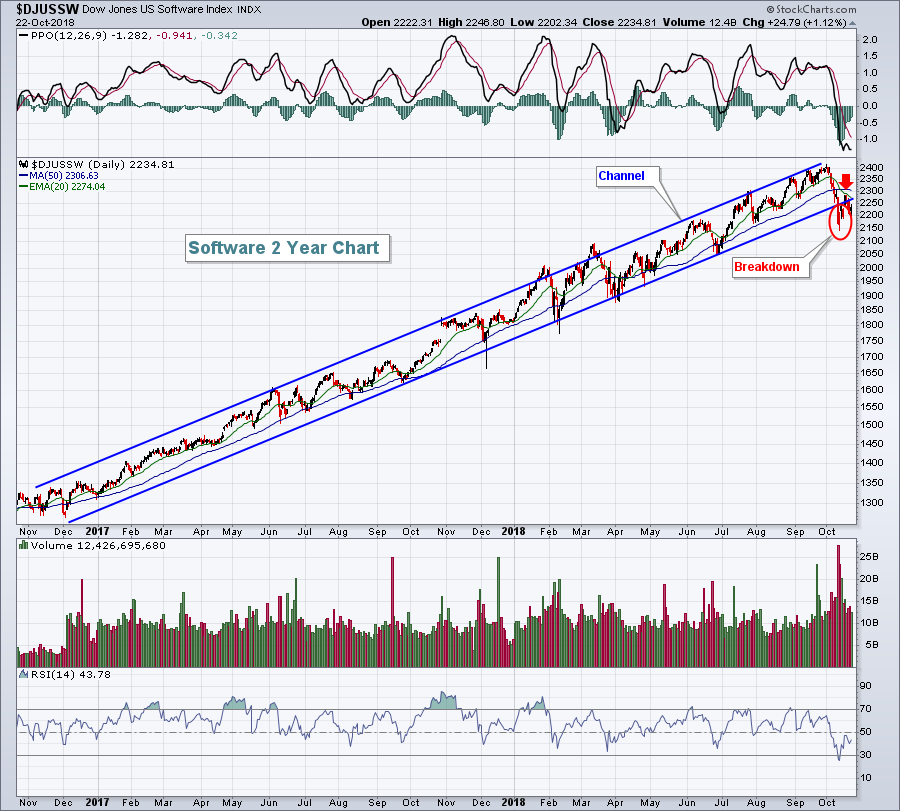 Volume accelerated on the recent selling as a multi-year up channel snapped. That is going to lead to further short-term selling, in my opinion. A major bottom in the index is likely to be carved out, but where will the bottom be? I don't have the answer as support levels during panicked selling don't seem to matter much. I'd rather sit on the sidelines with my capital intact and let the market determine that bottom for me.
Consumer discretionary strength came mostly from retail with the widely diversified S&P retail ETF (XRT, +1.10) bouncing. This area too is broken, however:
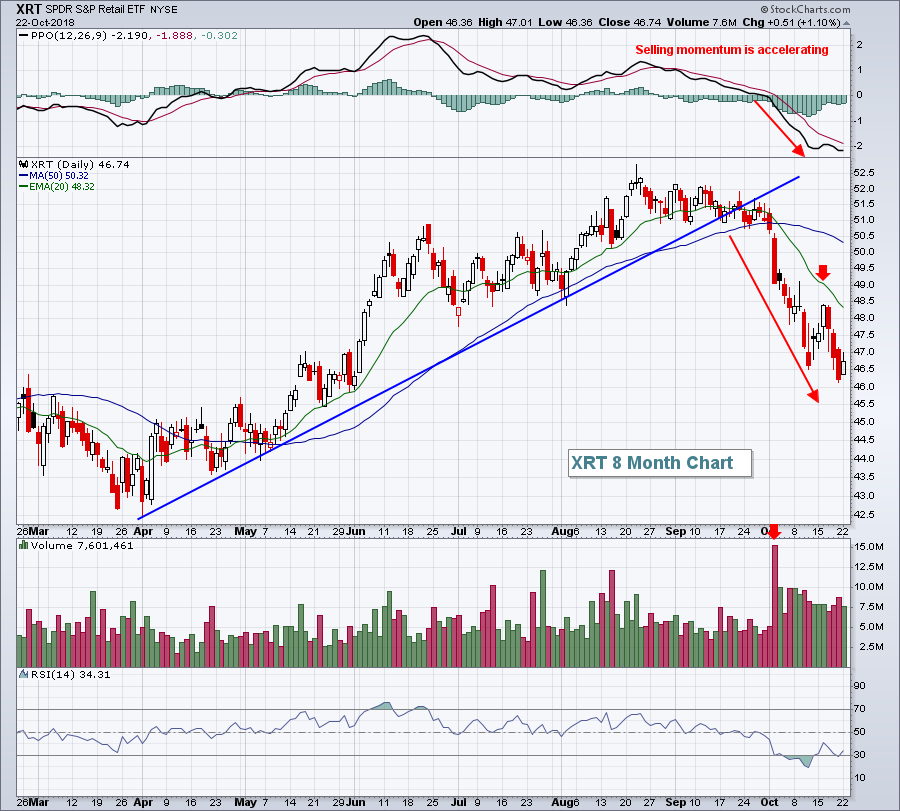 Those are two charts of our "leaders". The clear leaders from 2018 are broken, which will make it very difficult for the U.S. stock market to regain its footing any time soon. Yes, we'll see bounces after panicked bouts of selling, but trying to time those bounces will be extremely difficult and will be laced with extraordinary risk. I'll sit it out for now.
Pre-Market Action
With a little more than 30 minutes left to the opening bell, Dow Jones futures are down more than 400 points, taking a cue from global markets that were pummeled overnight in Asia and this morning in Europe. Volatility ($VIX) is jumping and is much higher than normal. We know impulsive selling can follow with little help from technical support levels so everyone should be very careful in this environment.
Caterpillar (CAT) and 3M (MMM) reported quarterly earnings and both are down roughly 7% in pre-market action. McDonald's (MCD), however, posted very solid results and is bucking the selling trend this morning, up more than 2% currently. It'll be interesting to see if MCD can hold onto its pre-market gains if the U.S. stock market remains in a foul mood today.
Current Outlook
Perhaps my biggest question as we move into the latter stages of 2018 and into 2019 is.....will a rising U.S. Dollar Index ($USD) begin to lift the small cap Russell 2000 ($RUT) relative to the larger cap Dow Jones ($INDU) and S&P 500 ($SPX)? The USD appears to have just broken out of a bullish inverse head & shoulders pattern, which projects much higher. Generally, a rising dollar will benefit small caps as large caps' earnings suffer from foreign currency translation losses when a strong dollar persists. Check out this chart:
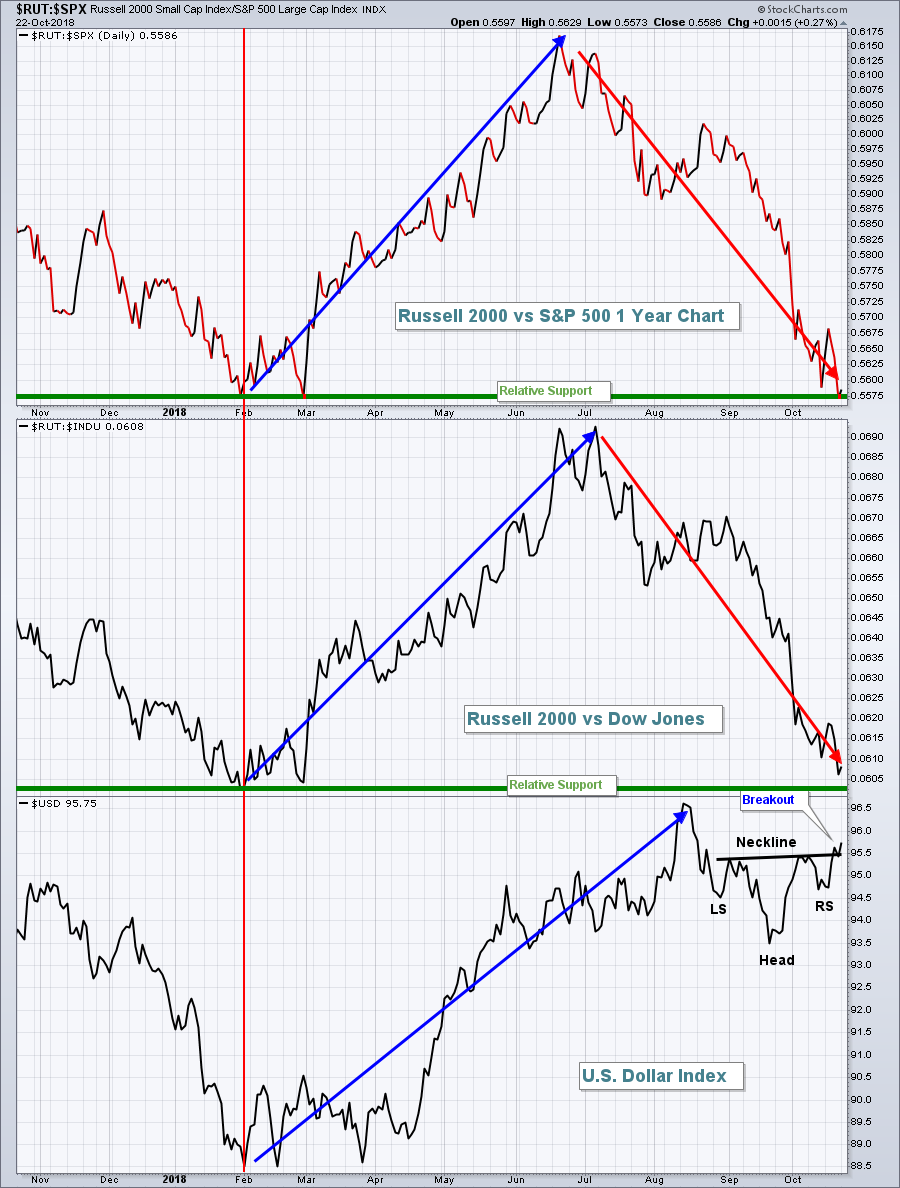 Until summer, I think it's fairly obvious that small caps' relative performance was tracking the dollar's movements quite closely. But when the dollar simply pulled back and consolidated in bullish continuation fashion (inverse head & shoulders), small caps gave back ALL of its relative gains and now is testing a key relative support level. I fully expect the USD to rise over the next several months, which should result in small cap outperformance. If you begin to see this relative ratio strengthen, you may want to overweight the small cap group.
Sector/Industry Watch
Financials (XLF) posted a big loss on Monday and broke down to close at their lowest level in nearly a year. There's an intraday low earlier in October near 26.00, but we haven't see a close this low since November 2017:
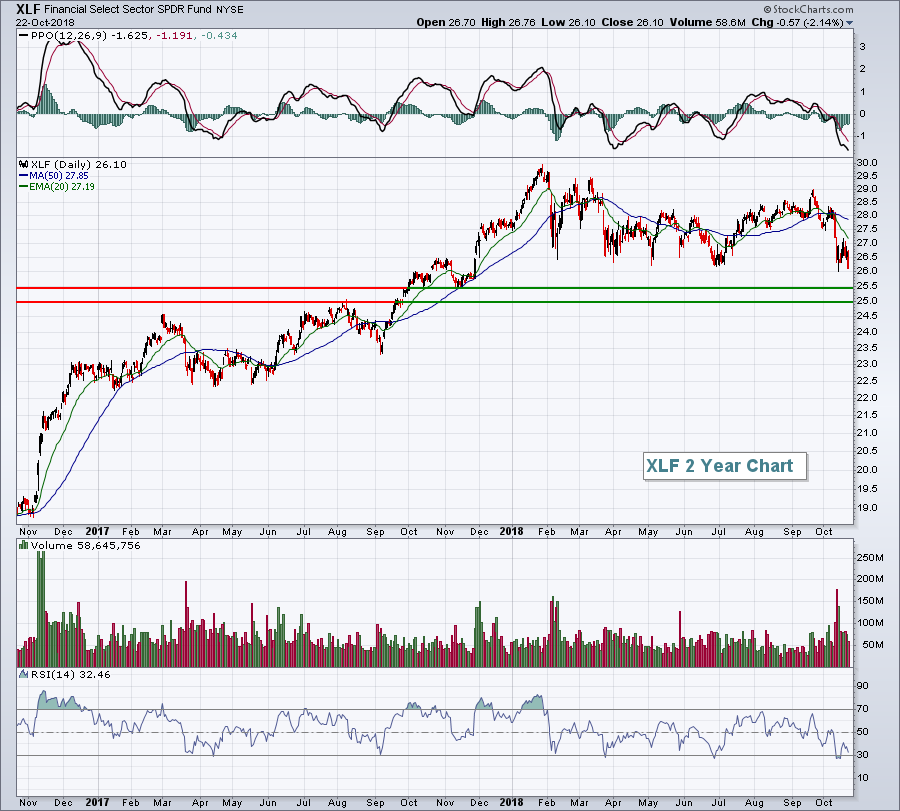 I'd expect a further drop to the 25.00-25.50 area to test support after the September 2017 breakout and the subsequent October and November lows. If 25 support doesn't hold, selling could escalate quickly with the next key support level being around 23.30 (September 2017 low). The interesting part is that the XLF is struggling during a period of rising interest rates. Typically, when money is rotating away from treasuries, the financial sector is one that benefits. We haven't seen that at all with the latest jump in the 10 year treasury yield ($TNX). I don't ignore price action.
Historical Tendencies
Want some good historical news? The U.S. stock market enters its most bullish period of the year at the close on October 27th and it runs through January 19th. We'll likely have to battle significant weakness this morning and throughout the short-term, however, before stock market skies become clearer.
Key Earnings Reports
(actual vs. estimate):
BIIB: 7.40 vs 6.80
CAT: 2.86 vs 2.83
CNC: 1.79 vs 1.77
DGX: 1.68 vs 1.68
FITB: .64 vs .63
GLW: .51 vs .48
HBAN: .33 vs .32
LMT: 5.14 vs 4.32
MCD: 2.10 vs 1.98
MMM: 2.58 vs 2.70
NEE: 2.18 vs 2.14
PCAR: 1.55 vs 1.50
RF: .32 vs .36
TRU: .65 vs .63
UTX: 1.93 vs 1.81
VZ: 1.22 vs 1.19
WAT: 1.92 vs 1.90
(reports after close, estimate provided):
AGR: .43
AMP: 3.61
CB: 2.38
CNI: 1.12
COF: 2.89
CSGP: 2.06
EQR: .83
EW: 1.02
IEX: 1.31
ILMN: 1.25
JNPR: .44
TSS: 1.09
TXN: 1.53
VAR: 1.19
Key Economic Reports
None
Happy trading!
Tom
