Market Recap for Monday, October 8, 2018
Consumer staples (XLP, +1.38%) and real estate (XLRE, +1.29%) helped to power Monday's reversal, but that was not enough to turn around the fortunes for the NASDAQ, which still dropped more than 50 points as technology (XLK, -1.13%) stumbled for a third consecutive day. It's difficult to believe that the XLK was at an all-time high last Wednesday. Software ($DJUSSW) and semiconductor ($DJUSSC) stocks have been under intense selling pressure, reminiscent of the late-June selling.
While yesterday's bullishness in consumer staples and real estate managed to lessen the pain on our major indices as the Dow Jones finished in positive territory after being down more than 200 points intraday. Don't count on real estate to continue to provide the lift that it did yesterday, however, as technical conditions here are anything but bullish:
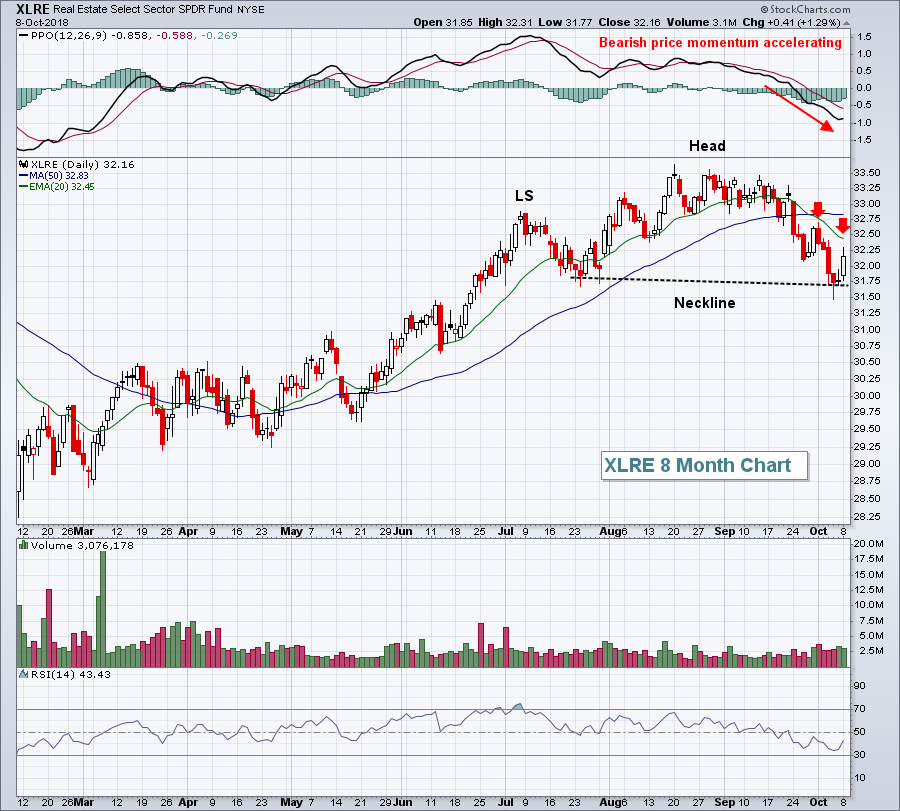
Yesterday's strength in the XLRE could be marking the beginning of a right shoulder in a topping head & shoulders pattern. During bull markets, I typically avoid trying to spot topping patterns as it's usually an exercise in futility and one that results in trading losses, especially if you decide to short within a bull market environment. Nonetheless, it's worthwhile noting the pattern should it execute with a breakdown below neckline support.
Crude oil prices ($WTIC) have pulled back over the past few sessions and that's left energy (XLE, -0.08%) a bit vulnerable. The XLE has been bumping up against price resistance in the 77-78 area that's been established based upon multiple visits to that area in 2018. Yesterday's XLE close was 77.10. A close above 78 would be near-term bullish for energy.
Pre-Market Action
The 10 year treasury yield ($TNX), which has been in focus since breaking to 7 year highs, is up slightly this morning to 3.24%. The dollar is showing strength as well, with gold ($GOLD) just above key price support at $1280 per ounce.
Overnight, Asian markets were mixed, while Europe is having another weak day. The German DAX ($DAX) will be worth watching as that index is now trading back near 2018 lows. The closing low on the DAX was 11787 on March 26th. At last check, the DAX was down 80 points to 11867. The reason this is significant is that the DAX-SPX price correlation is very positive, perhaps moreso than any other country. A breakdown in the DAX would be a negative for U.S. stocks.
With just over 30 minutes to the opening bell, Dow Jones futures are lower by 117 points. It should be another interesting day to watch our major indices, with one eye on the Volatility Index ($VIX).
Current Outlook
I've already begun to hear media outlets slinging around "bear market" again. It just makes me laugh. We're 3-5 days removed from all-time highs in many areas of the market. But every single time the market takes a breather, the bear market talk begins. It's why I almost never listen to CNBC or any of the other talking heads. They're after ratings and we all know that fear sells.
Remember one important fact. Bear markets never begin because of a bout of selling. A bear market is a process. There has to be a shift in psychology, not to mention eventual signals of slowing economic growth. We have neither. Yes, the Volatility Index ($VIX) has spiked and that's a requirement for a bear market. But the VIX spikes during every selling episode. That is NOT the key. The key is whether it comes back down when the market bounces. As a refresher, here's a long-term chart of the VIX so that you can see what the VIX looks like during both bull and bear markets:
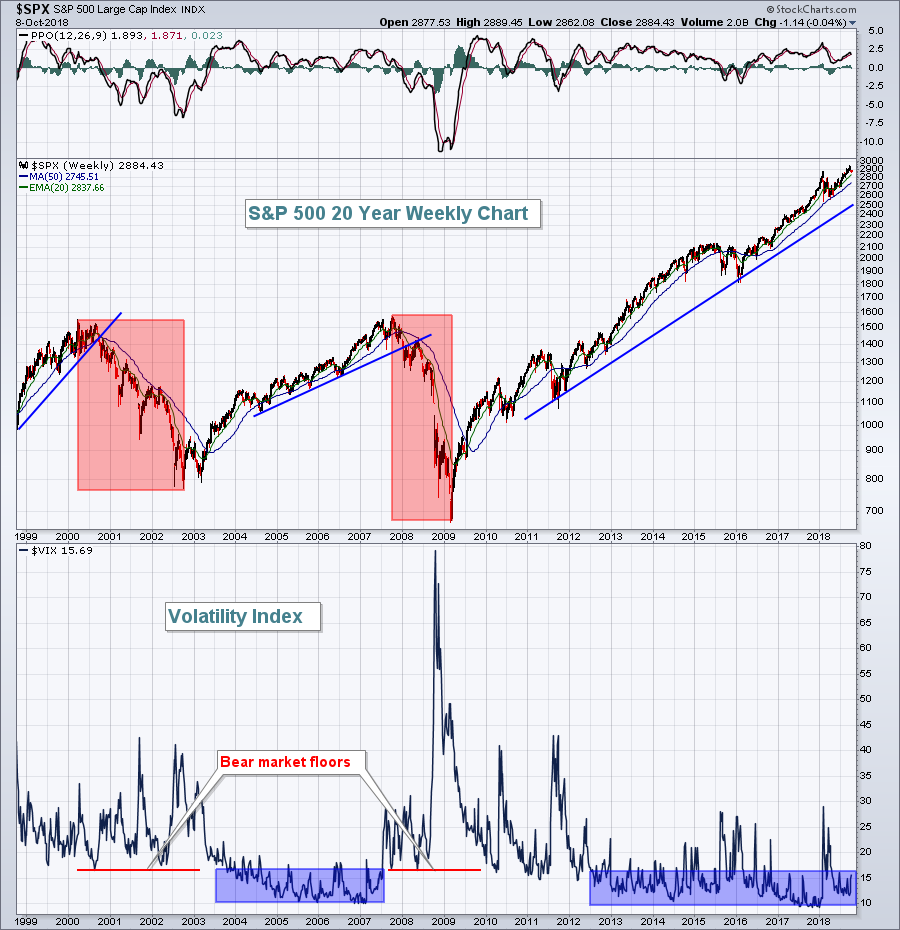 The VIX has spent ZERO time below 16 during the last two bear markets. You can't have a tornado without volatile weather conditions. And you can't have a bear market without volatile market conditions. The blue shaded areas above show the VIX regularly returning to low double digits during extended bull markets. There are spikes, but fear settles back down as the S&P 500 bounces. That's what we want to focus on. We'd likely need the VIX to move decidedly above 20-25, maybe into the 30s and 40s as price uptrends are broken. If that occurs, then it would become "sell the rally". From a longer-term perspective, if you ran for the hills every time we had a short-term blip in the VIX, you'd go nuts. So, in my opinion, the current market volatility is nothing more than a short-term nuisance - for now. I do find it much more difficult to trade when the VIX rises like it has the past week or so because support levels tend to be of little significance when panicked selling kicks in. The market sells off so quickly that keeping tight stops is generally a recipe for quick losses. As I get stopped out of positions, my tendency is to remain in cash until there are signs of a VIX top. The long tails are definitely a signal that the VIX may have topped, but remember that recent tops and long tails in the VIX have been followed up with retests of price lows. April and June were two recent examples.
Sector/Industry Watch
Distillers & Vintners ($DJUSVN) have gained more than 5% over the past week, leading the consumer staples sector. The longer-term weekly trend appears to be regaining strength after a negative divergence slowed the group down for months:
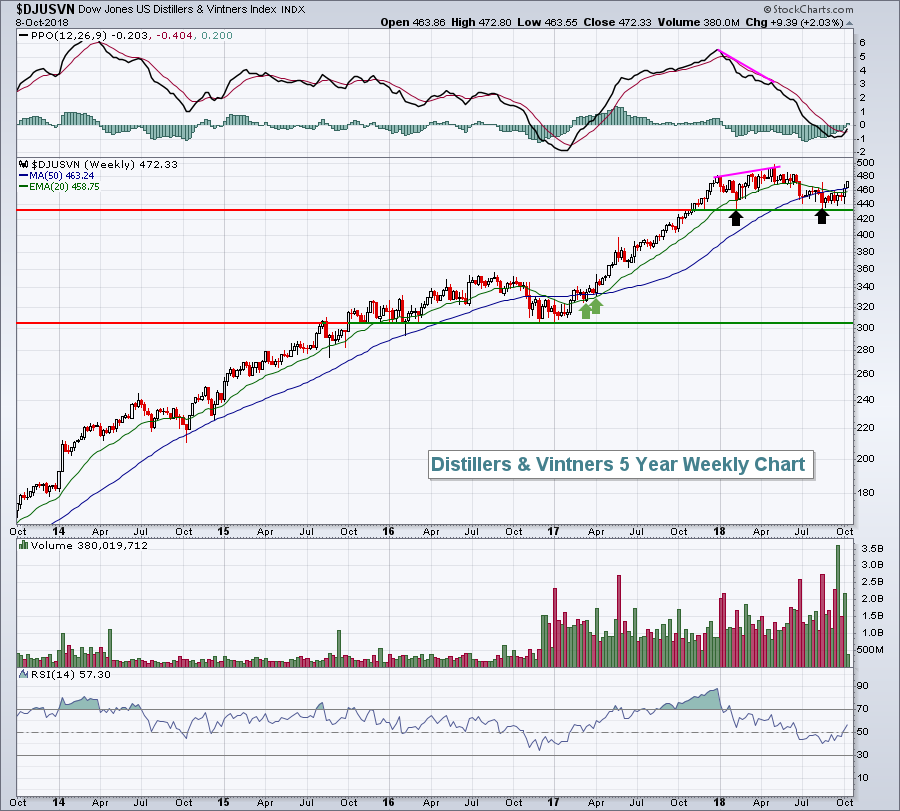 The setup looks strikingly similar to early 2018, when a negative divergence preceded a price move below the 20 week EMA and 50 week SMA to test prior price support. But the DJUSVN regained strength, cleared its 20 week EMA and held that moving average on subsequent pullbacks. So the key here will be whether the now-rising 20 week EMA holds as support during pullbacks. If so, we've likely got a solid performer heading into 2019.
Historical Tendencies
I had previously mentioned that the Russell 2000 ($RUT) - for whatever reason - does not like the first 9 calendar days of October, where it's produced annualized returns of -65% since 1987 and has severely underperformed the other major indices. Well, today is October 9th. The U.S. Dollar Index ($USD) has been rising so if the equity market can scratch out a bottom and begin moving higher, it will be interesting to see if bullish historical trends begin to kick in for this small cap index. Since 1987, the annualized return for the RUT from October 10th through 21st is +45%, a sudden and complete reversal of what we generally see from the 1st through the 9th.
Key Earnings Reports
None
Key Economic Reports
None
Happy trading!
Tom
