Market Recap for Monday, November 5, 2018
Bifurcated market action dominated on Monday. The Dow Jones and S&P 500 gapped higher and traded higher throughout nearly all of the session. The NASDAQ and Russell 2000, on the other hand, struggled throughout most of the day with an afternoon rally failing to clear the flat line by day's end. Weakness was once again felt in key sectors - communication services (XLC, -0.41%) and technology (XLK, -0.10%) - although both rallied well off their intraday lows. The leaders included energy (XLE, +1.67%) and real estate (XLRE, +1.66%), the latter being a defensive sector. The other defensive sectors - utilities (XLU, +1.41%) and consumer staples (XLP, +1.25%) - both performed relatively well. So while it was a "feel good" kinda day, we still are not seeing the risk-on mentality necessary to resume the 9 1/2 year bull market.
We're still in dangerous territory in terms of sentiment. The Volatility Indices ($VIX - S&P, $VXN - NASDAQ 100) are both elevated and that reminds us that impulsive selling could resume at any time. On the NASDAQ 100 ($NDX), yesterday's action was both bullish and bearish. Check out the chart:
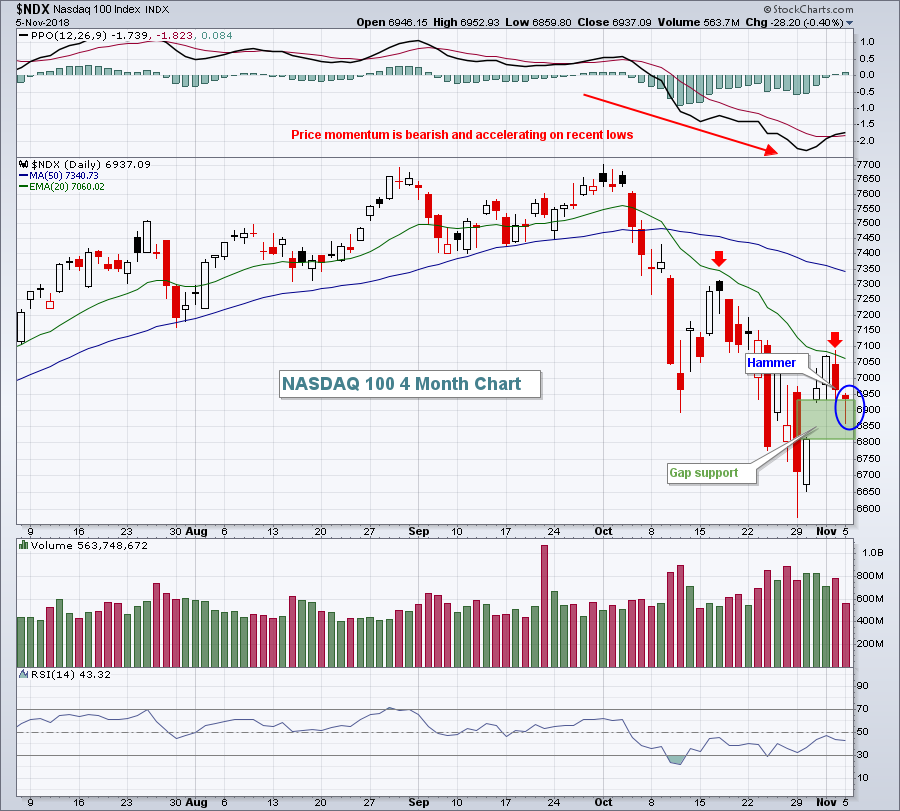 This near-term 4 month chart mostly supports the bearish case. Price action broke down and we've yet to re-establish price action above the declining 20 day EMA. That's a necessary first step. During yesterday's action, however, the NDX was well into its gap support zone, appearing headed for a test of gap support close to 6800. But a hammer printed and NDX held onto the top of its gap support zone at 6933. It was a kick save for the bulls. The PPO has begun to turn higher, but I prefer looking at PPOs on recent closing lows (the PPO is calculated using closing prices). Each of the last two price lows have been accompanied with a lower PPO, a signal that the bears remain in control of price momentum. Generally (certainly not always) declining 20 day EMAs provide overhead resistance when price momentum is bearish. Thus far, that 20 day EMA (red arrows) has not been penetrated on a close.
Pre-Market Action
The U.S. Dollar ($USD) is retreating this morning vs. foreign currencies and gold ($GOLD) has moved back within striking distance of $1240 per ounce, up $4 this morning to $1236 per ounce. Crude oil ($WTIC) is trading near $63 per barrel as black gold continues to struggle to find support.
Asian markets were mostly higher overnight, but mixed, while European markets are lower. U.S. futures are pointing to a lower open on Election Day 2018. At last check, Dow Jones futures were lower by 55 points with roughly 45 minutes left to the opening bell.
Current Outlook
Performance of bank stocks ($DJUSBK) is important as our economy is highly leveraged and debt-driven. While I don't look to banks to lead the stock market higher, I generally want to see banks going along for the ride. A weakening banking group can lead to tighter credit, which obviously becomes problematic for growth in Corporate America. Recently, we saw the DJUSBK close below a key area of price support near 450:
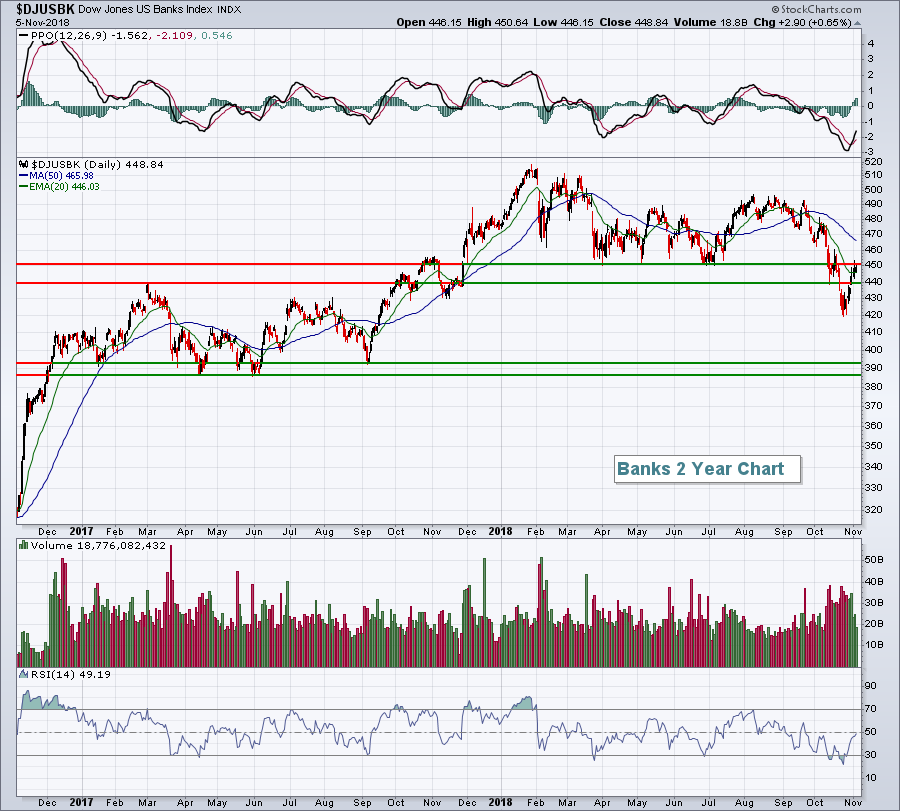 We've seen an oversold bounce back to the 450 level, but what do banks do from here? If the recent October low doesn't hold, it would be easy to see a technical drop to 390 or so. The bulls want to see a continued climb here, however, clearing not only the 450 level, but also the declining 50 day SMA that currently resides at 465.
Sector/Industry Watch
Oil equipment & services ($DJUSOI) has been a major laggard in 2018, but it's become very oversold and is ripe for a rebound after a disastrous 3-4 week stretch:
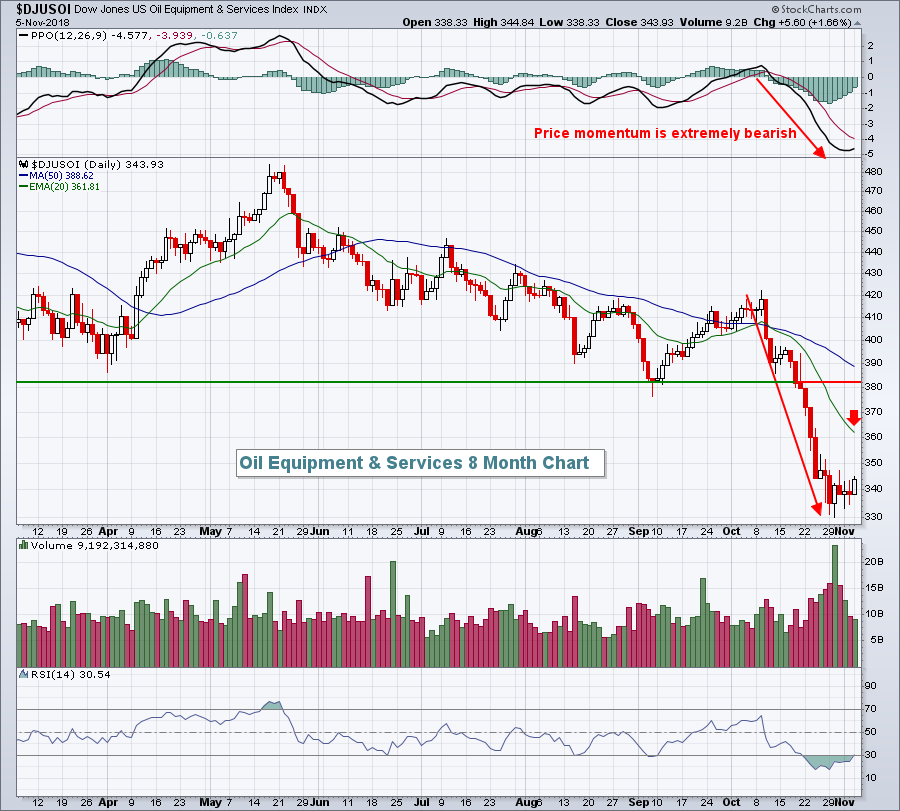 I expect a bounce here. The two key levels of resistance to watch will be the declining 20 day EMA, currently at 361.81, and price resistance just above 380. Energy (XLE) was the best performing sector yesterday and the third best over the past week as traders seek out a bit of value in the very near-term. While I don't expect the buying to last for long, there's definitely more room to the upside and the DJUSOI could move to at least test its declining 20 day EMA.
Historical Tendencies
One stock that loves the next several months is Helmerich & Payne (HP), an oil equipment & services stock. Here are the stock's average monthly returns looking ahead:
November: +1.2%
December: +6.4%
January: +3.7%
February: +4.0%
March: +3.6%
April: +4.9%
If you add those numbers up, you'll get +23.8%. That's not a bad average return for six months over a 20 year period. The other six months, May through October, have produced an average return of -3.9% over the same 20 year period. I'd say HP has entered its bullish historical period.
Key Earnings Reports
(actual vs. estimate):
ABC: 1.45 vs 1.44
ADM: .80 vs .92
APD: 2.00 vs 2.00
BDX: 2.93 vs 2.92
BR: .79 vs .70
CVS: 1.73 vs 1.71
EMR: .89 vs .92
HSIC: 1.03 vs 1.01
LLY: 1.39 vs 1.37
REGN: 5.87 vs 5.21
TDG: 4.44 vs 4.27
TM: 3.59 vs 3.17
(reports after close, estimate provided):
DVN: .43
DXC: 1.96
GDDY: .18
MTCH: .36
PAA: .37
PXD: 1.69
Key Economic Reports
None
Happy trading!
Tom
