Market Recap for Monday, November 26, 2018
Yesterday marked the first day in quite awhile where we saw all of our major indices higher, along with all of our sectors. All eleven sectors gained ground, even the defensive sectors - though they lagged badly on a relative basis. Leading the charge were communication services (XLC, +2.28%), technology (XLK, +2.26%) and consumer discretionary (XLY, +2.24%). Financials (XLF, +2.04%) was the fourth of our aggressive sectors to post a gain in excess of 2%. While this action changes absolutely nothing on the charts, it did provide short-term relief to key areas of the market that have been bludgeoned the past two months.
Among industry groups, leadership returned to internet ($DJUSNS, +2.91%) and software ($DJUSSW, +2.68%) stocks. The latter has bounced off an important price low from late June and we've seen three hollow candles in the past four trading sessions, potentially a sign of accumulation. We'll need to see more strength to confirm that, however. In the meantime, here's the chart:
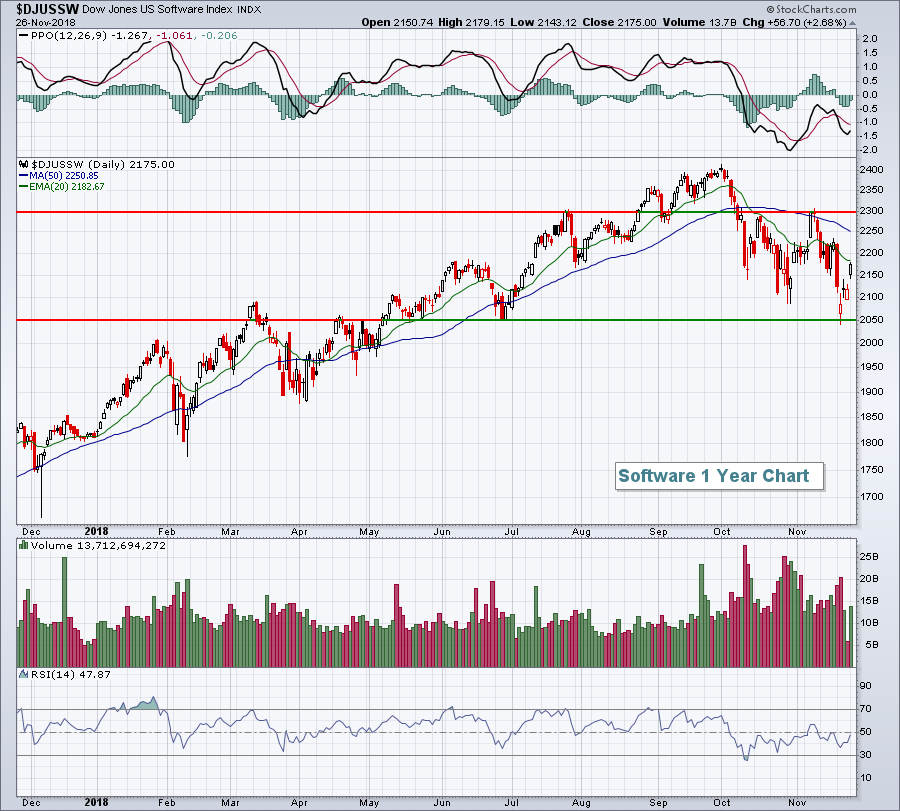 Software is currently in the middle of a very wide trading range from 2050 to 2300. Loss of 2050 support would be another key checkmark in the bear's column as continuing price breakdowns of previously leading industry groups is a hallmark of a bear market.
We could be in a period of sideways consolidation on the hourly charts where moving averages become worthless signals. If we fail to hold rising 20 hour EMAs and that failure occurs quickly, then we should pay much more attention to price support and resistance and less attention to moving averages. Our first test could come today as you can see from the following chart:
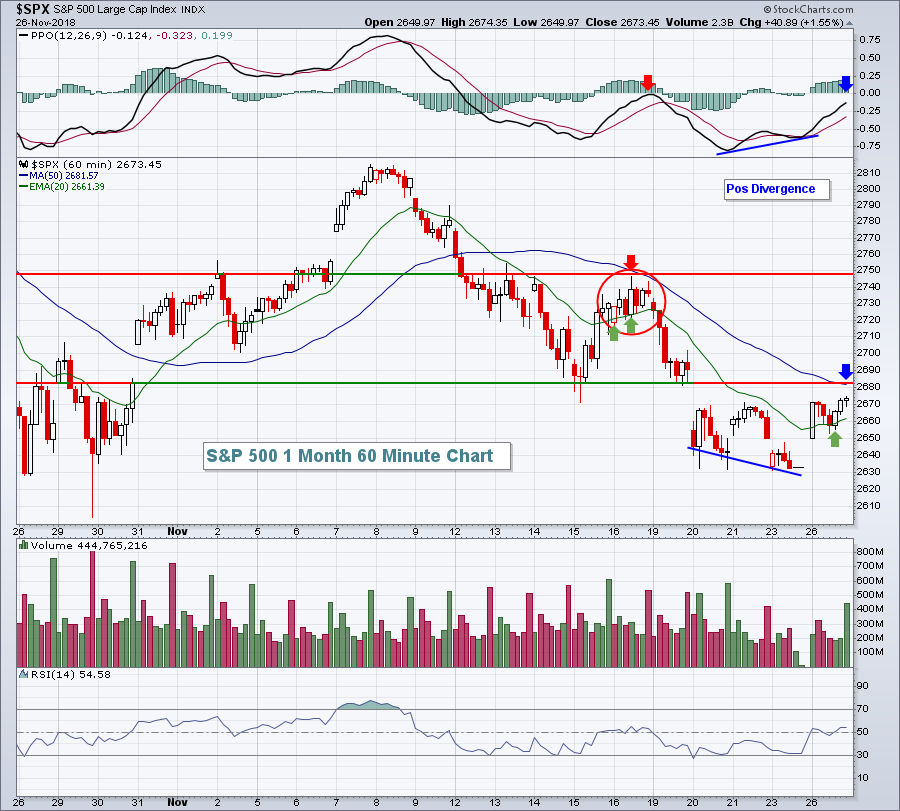 The red circle in mid-November highlights the struggles that the bulls face in the short-term. After piercing the 20 hour EMA resistance, the bulls could not sustain the action to the upside. There was a failed test at PPO centerline resistance (red arrow) and short-term price momentum remained bearish. The current rally will face a similar test today or possibly later this week. The recent positive divergence suggested we'd move through the 20 hour EMA and potentially "reset" the PPO at centerline resistance as the 50 hour SMA is tested (blue arrows). That 50 hour SMA test would coincide with a very important test of price and gap resistance from 2680-2690. A confirmed break above that price range would likely lead to a new wave of technical buying. Until then, the short-term belongs to the bears.
Pre-Market Action
U.S. futures suggest a negative open when Wall Street opens in approximately 45 minutes. Potential iPhone (and laptop) tariffs are taking an early toll on Apple (AAPL), which in turn is resulting in overall market weakness. Rising 20 hour EMA support could be tested early with the impending gap lower this morning.
Crude oil ($WTIC) is down fractionally this morning and currently trades just above $51 per barrel.
Current Outlook
Railroads ($DJUSRR) are always an industry group to keep a close eye on. Most notably, they're a proxy for our domestic economy. The U.S. stock market has easily outperformed most every other major stock market around the world in 2018 and the Fed keeps reminding us of our strength. The Fed is widely expected to raise the fed funds rate by another quarter point next month when they meet. A technical failure on the part of railroads would likely send shock waves through our market and would also be a centerpiece in a bearish argument moving into 2019. Thus far, the DJUSRR has held up relatively well. Here's the key support to watch in the near-term:
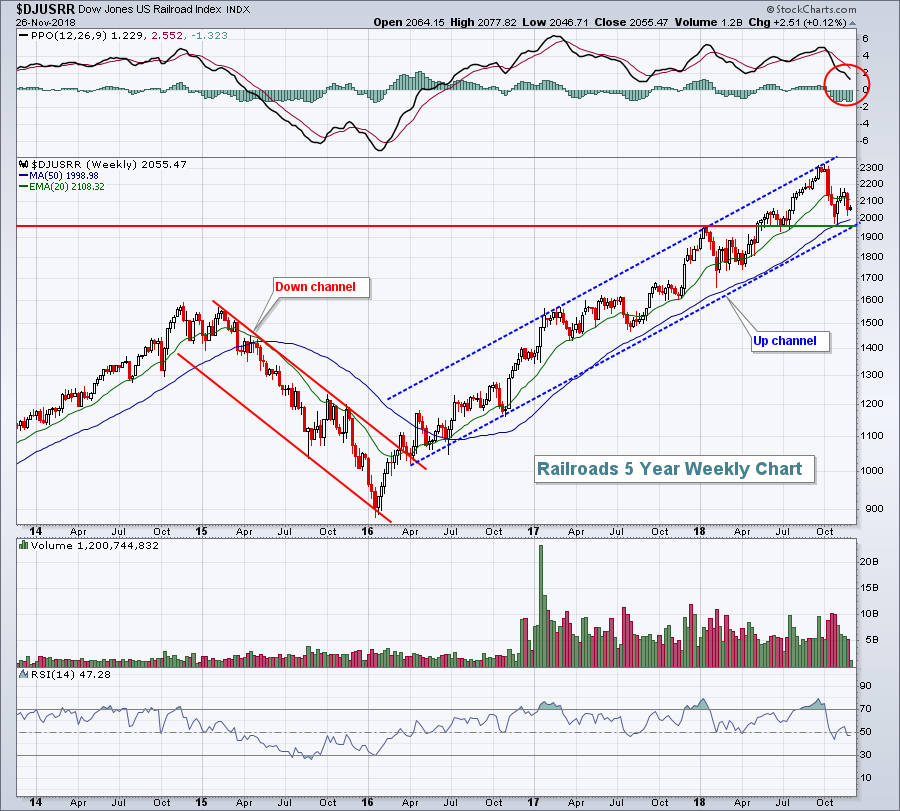 There's a clearly defined channel that remains intact. Also, previous lows in 2018 mark a very important price support level. Both of these - channel support and price support - intersect in that 1950-1960 area. If railroads lose that support, it would almost certainly confirm the arrival of our next bear market.
Sector/Industry Watch
The Dow Jones U.S. Home Construction Index ($DJUSHB) appears to be printing a bottom at key price support. We've seen a huge selloff in 2018 and we might see another bout of selling to test recent lows, but this is an area where I'd look for a reversal:
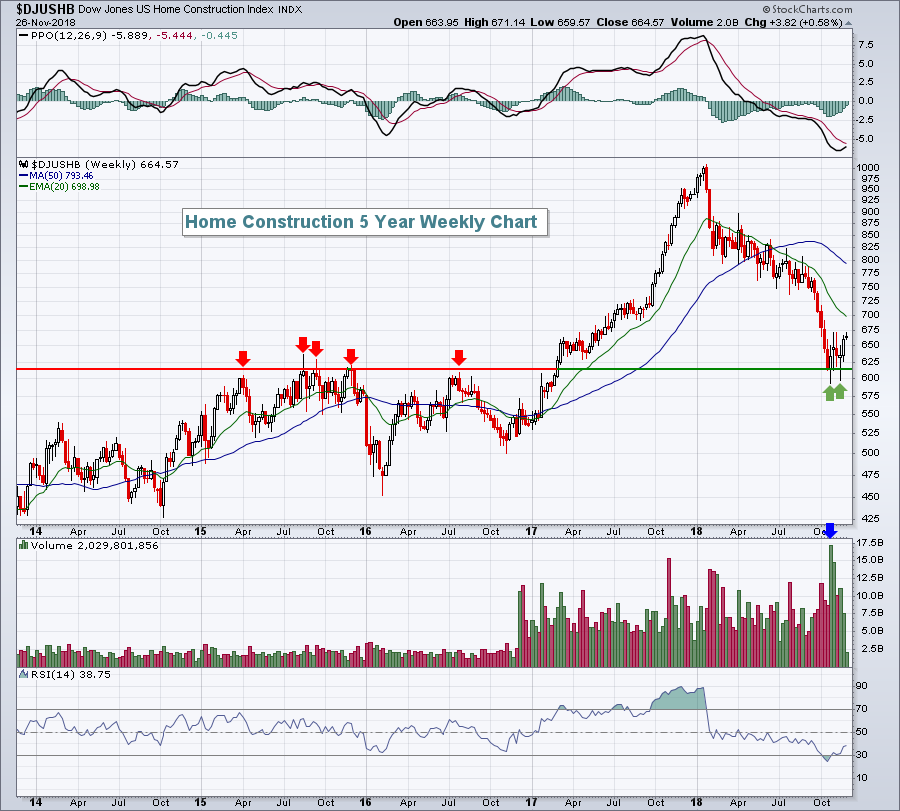 The red arrows mark very obvious price resistance that, once broken in 2017, led to a massive rally in home construction. That was followed up with a significant decline in 2018 with recent lows testing the price support (green arrows) left behind from that 2017 breakout. Not to be overlooked is the very heavy volume taking place at support. From a short seller's perspective, it reeks of accumulation in my opinion.
Historical Tendencies
Incyte Corp (INCY) has an enviable track record from November through January. It's averaged gaining 22.6% per year during this period over the past two decades. 70% of its 20 year cumulative gain has come during this three month period. Technically, INCY is attempting to put in a bottom after a lengthy and painful downtrend:
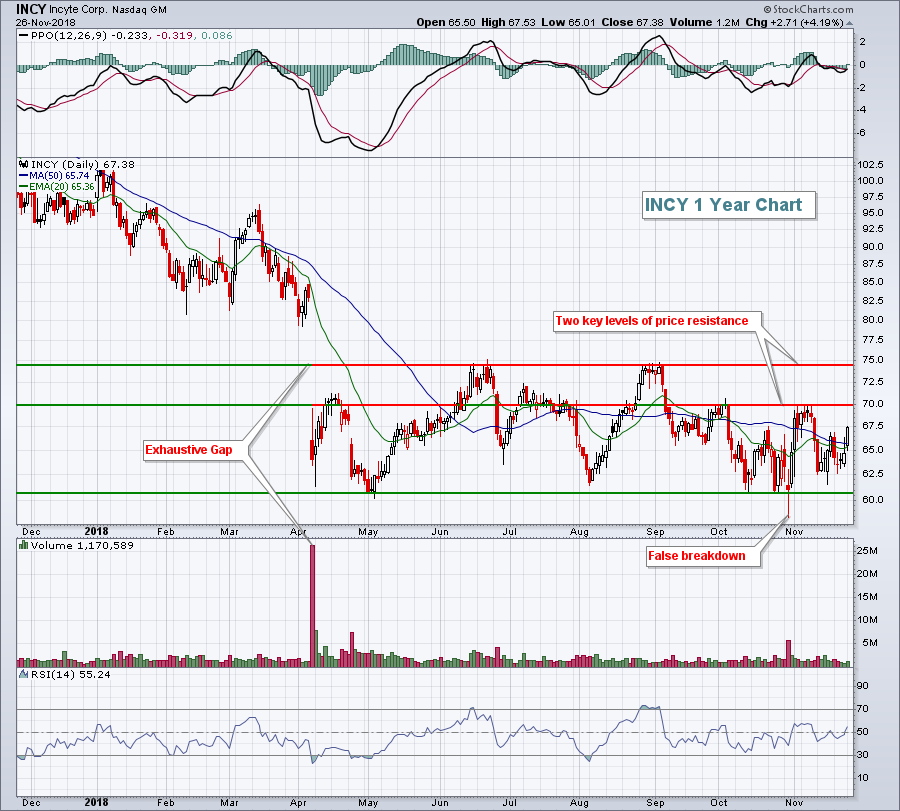 I don't believe a definitive bottom will be in until INCY can clear 75 for confirmation. It is interesting and somewhat ironic, however, that the false breakdown occurred in late October, just before INCY's three month historical bullish period begins.
Key Earnings Reports
(actual vs. estimate):
BNS: 1.35 vs 1.35
(reports after close, estimate provided):
CRM: .50
NTNX: (.27)
Key Economic Reports
September Case Shiller HPI to be released at 9:00am EST: +0.3% (estimate)
September FHFA house price index to be released at 9:00am EST: +0.3% (estimate)
November consumer confidence to be released at 10:00am EST: 136.5 (estimate)
Happy trading!
Tom
