Market Recap for Thursday, December 13, 2018
The U.S. stock market attempted to stage rallies on Thursday, initially in the morning session and then again in the final hour. But astute technicians that follow more than the headline Dow Jones and S&P 500 numbers realized it was a rally likely to fail. Why? Well, primarily because we're residing beneath declining 20 day EMAs and the leaders of the "rally" were utilities (XLU, +0.87%), real estate (XLRE, +0.69%) and consumer staples (XLP, +0.62%). Defensive sectors......blech!
Indices and sectors that should perform well during U.S. economic expansion were getting crushed in the meantime. Let's look at those small cap stocks that do nearly all of their business domestically:
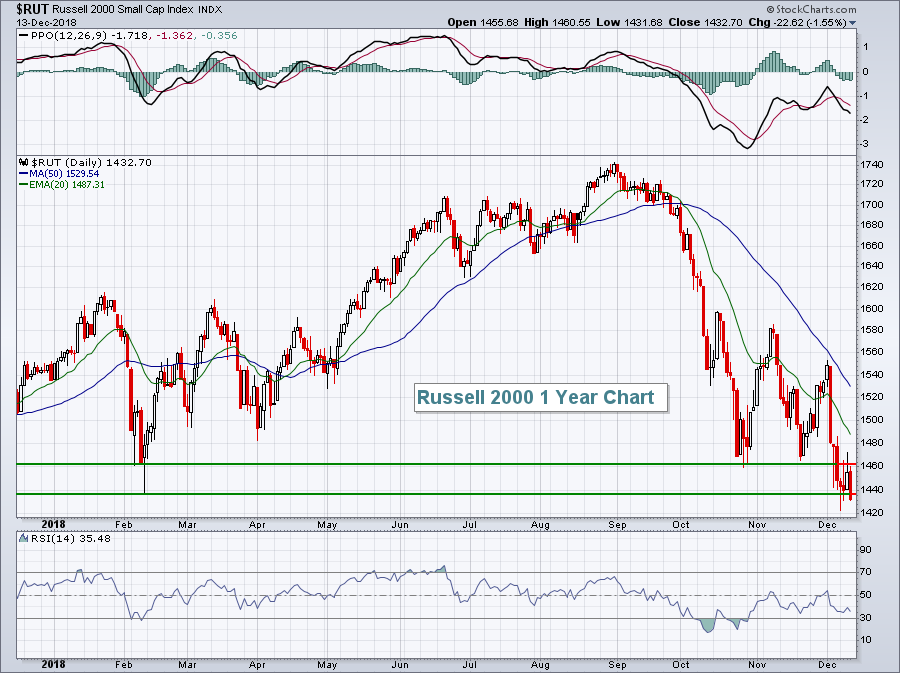 The closing support level from February was lost a week ago. Yesterday, the Russell 2000 cleared the February intraday low to close at its lowest level of 2018. That sounds like the start of a bear market to me. How about transports ($TRAN). The Fed has been telling us of its multiple intended rate hikes in 2019 because of our wonderful economy. In a strong or strengthening economy, transports should perform extremely well. The stock market looks ahead, so we should see a surging transports group to reflect the strengthening economic conditions ahead, right?
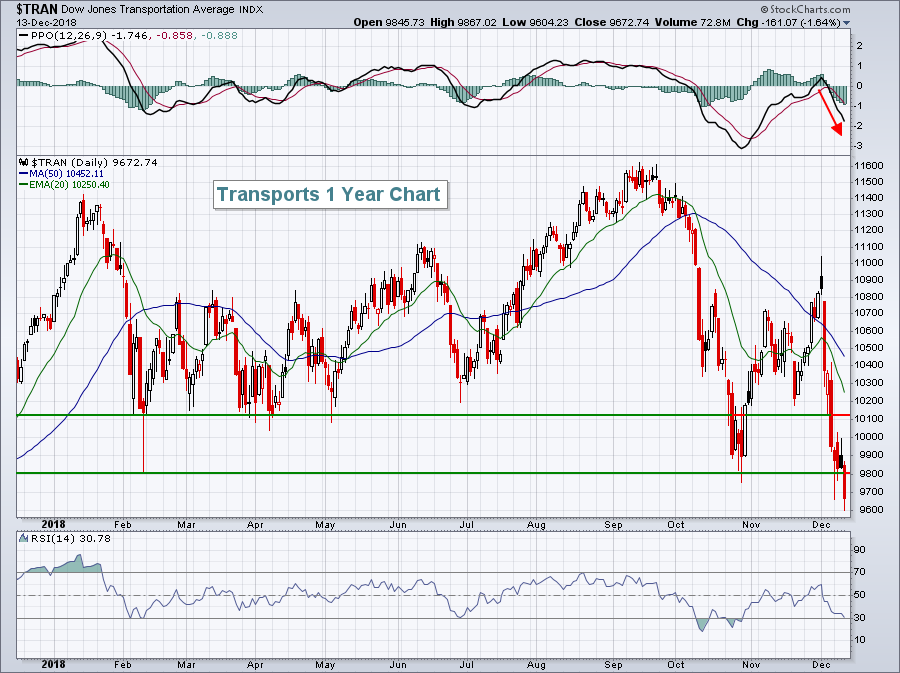 At yesterday's intraday low, the TRAN had fallen 2000 points in less than 3 months. Economic expansion ahead? Hhhhmmmm........
Yes, I'm still waiting for the S&P 500 to close below 2582 to confirm the beginning of a bear market. It's the benchmark that I follow to determine what type of market we're in. The S&P 500 represents 500 of the largest multinational companies in the world and is a great barometer to evaluate the big picture. A bull market is a series of higher highs and higher lows. A bear market is the oppposite, a series of lower highs and lower lows. The crossroad between the two is that February low. After the early January surge, the S&P 500 topped at an all-time high just shy of 2875. The reaction low close in February of 2582 was established with surging volatility ($VIX). The VIX hit 50 (!!!) intraday. High VIX readings are indicative of extremely emotional markets that carve out MAJOR price bottoms. 2582 is the number for me. A few days ago, the S&P 500 hit 2583 and buyers returned. I believe if 2582 is lost, we'll see a spike in the VIX that will likely trump most others during 2018 and further impulsive selling will kick in. Loss of 2582 will then likely mark the end of the "correction" and beginning of the "bear market".
Pre-Market Action
Despite a November retail sales report that matched, or slightly beat, expectations, money is rotating into treasuries once again this morning with the 10 year treasury yield ($TNX) down 2 basis points to 2.89%. As I pointed out on MarketWatchers LIVE yesterday, many bearish signals emerged as the TNX fell back below 3.00%. Look at this chart:
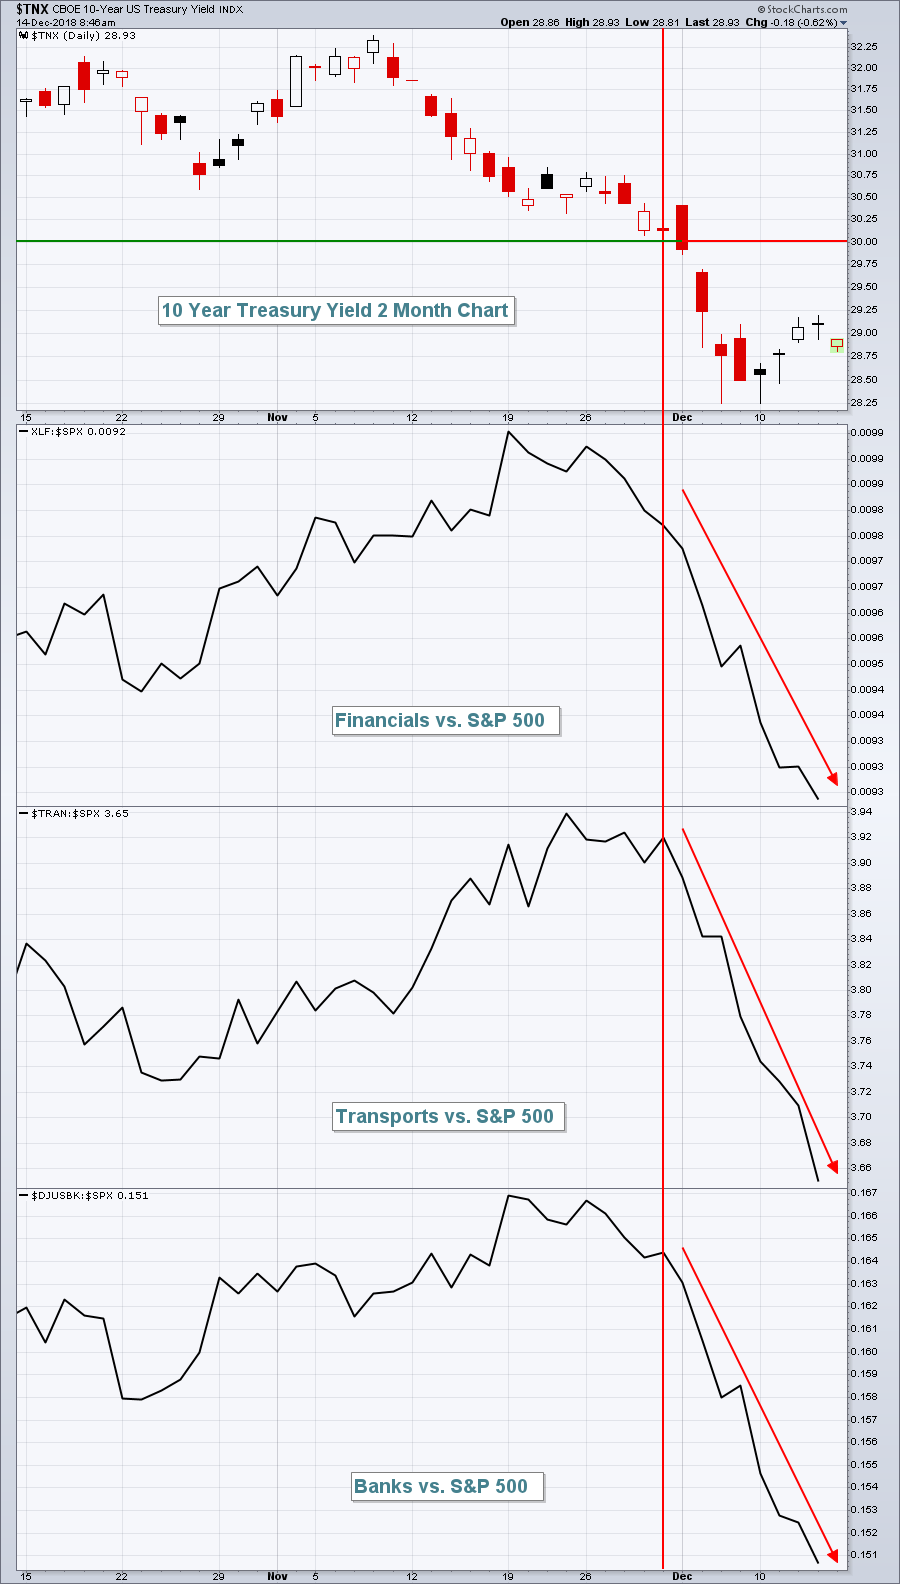 The above highlights a fact that most CNBC-annointed "experts" get wrong so many times, providing a major disservice to interested watchers who believe them. Higher interest rates are not bad for the stock market. Okay, that might be a slight exaggeration because if interest rates move too high, it can kill an economy. But folks, we're still near historic lows in terms of the 10 year treasury yield ($TNX). A rise from 3% to 4% won't have a damaging effect on a vibrant economy. In fact, it's that rotation from treasuries to equities that spurs an equity market advance.
Do you recall when the TNX rose from 3% to 3.25% and the "experts" were telling us that higher interest rates were driving the stock market lower? Where are those experts now? The TNX has fallen from 3.25% to 2.89%. Why aren't equities soaring based on their theory? Because it's hogwash. "Pay no attention to the man behind the curtain!" (for all of you Wizard of Oz fans)
Global markets are weak. Asian markets closed 1-2% lower overnight and Europe is down this morning, though well off their earlier lows. The U.S. equity market is looking to follow suit with Dow Jones futures lower by 200 points with roughly 15 minutes left to the opening bell.
Current Outlook
Many signs are pointing to the current correction becoming a bear market. Ultimately, it comes down to major price support for me. Does it hold? Thus far, it's held. If it doesn't hold as we move forward, though, we'll need to re-evaluate everything we do in the stock market. At least I will. The following chart is one you should ponder:
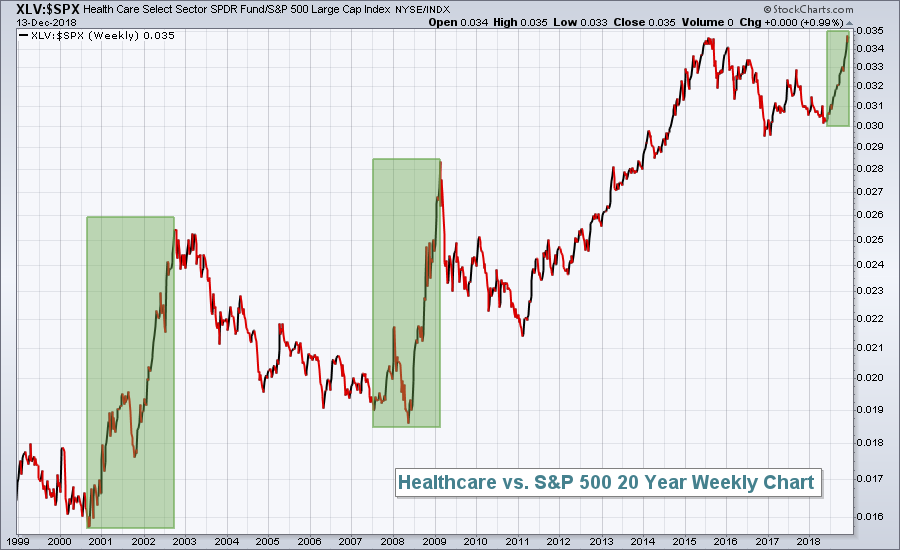 This chart highlights the fact that healthcare stocks tend to outperform the S&P 500 in a big, big way during bear markets. They provide an element of safety as healthcare is largely viewed as a defensive sector. But think about it, who stops paying for healthcare because we're in an economic slowdown, or even a recession? Now please don't misread the above chart. It's not telling us that healthcare stocks are rising. It's simply telling us that healthcare is outperforming. The healthcare ETF (XLV) actually declined during each of the prior two bear markets, it just simply didn't decline as much as the S&P 500. Nonetheless, if I trade long at all during a bear market, my positions will mostly be in healthcare, or more defensive names and areas. Trying to catch aggressive growth stocks during bear market rallies can be extremely dangerous. In all cases, be sure to keep your stops in place. Riding a bear market on the long side is devastating as most of us are already aware. Let 2000-2002 and 2007-2009 serve as lessons well learned. Should the S&P 500 begin rolling over - and the first step will be a close below 2582 - adjust your trading or investing strategy accordingly.
If you enjoy my analysis, please consider subscribing to my blog if you haven't already and join me every day on this stock market roller coaster ride! Simply scroll to the bottom of this article and provide your email address in the space provided, then click the green "Subscribe" button. Voila! It's completely FREE, let's me know you value the content here at Trading Places, and will result in every daily article being sent to the email address provided at the moment my articles are published. Happy holidays and thanks to everyone for your support!
Sector/Industry Watch
Key areas of healthcare (XLV) continue to perform quite well - so well, in fact, that you wouldn't know the U.S. stock market is in a correction and teetering on its first bear market in a decade. The following chart suggests a possible bullish ascending triangle on the XLV, while most other sectors trend lower:
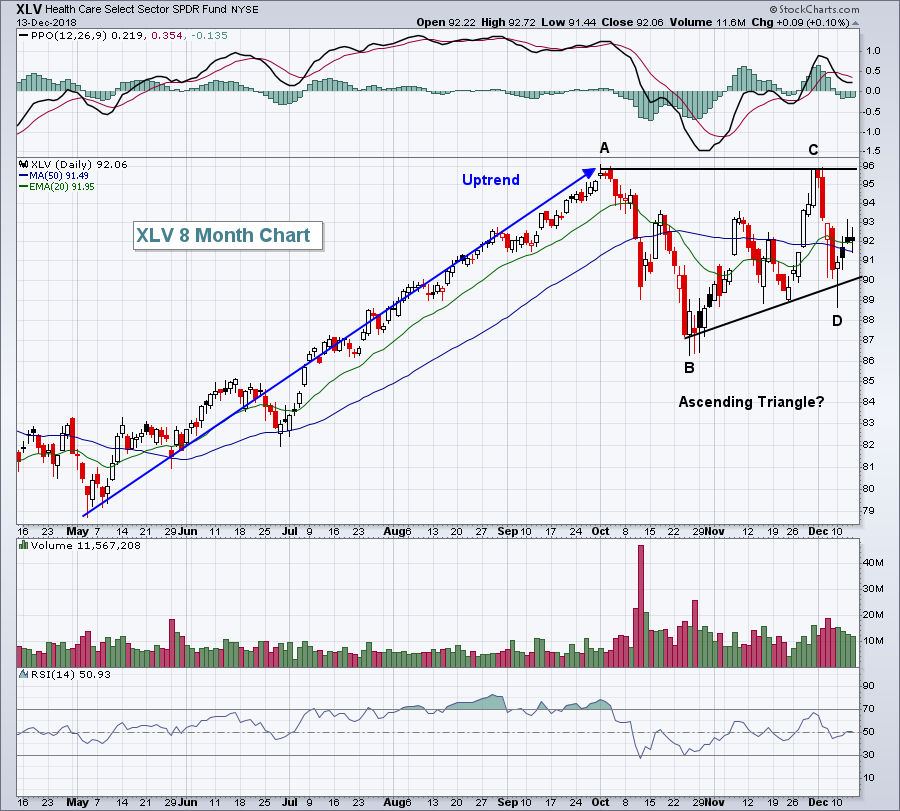 The Current Outlook section shows the relative strength of healthcare during bear markets. The Historical Tendencies section highlights the relative outperformance of healthcare stocks during December and January. And the above chart shows us the absolute strength in healthcare at the present time. If I place any long trades, I'll be leaning heavily towards healthcare stocks......and for good reason.
Historical Tendencies
Healthcare stocks (XLV) are in the midst of their two best months relative to the benchmark S&P 500. The XLV's relative outperformance is +0.7% and +1.6% during December and January, respectively, over the past two decades.
Key Earnings Reports
None
Key Economic Reports
November retail sales released at 8:30am EST: +0.2% (actual) vs. +0.1% (estimate)
November retail sales less autos released at 8:30am EST: +0.2% (actual) vs. +0.2% (estimate)
November industrial production to be released at 9:15am EST: +0.3% (estimate)
November capacity utilization to be released at 9:15am EST: 78.5% (estimate)
October business inventories to be released at 10:00am EST: +0.6% (estimate)
Happy trading!
Tom
