Market Recap for Tuesday, January 8, 2019
It was another broad-based rally on Wall Street with 10 of 11 sectors finishing higher. Small caps powered ahead 1.53% to lead the action, but the Dow Jones, S&P 500 and NASDAQ gained 1.09%, 0.97% and 1.08%, respectively, to join the party. After bottoming at 2346, the S&P 500 has recovered 228 points, or 9.72% - similar to what we've seen in the past after "correction to bear market" breakdowns. There's still more upside potential in this rally before the bulls will be put to the test, but a reversal could occur at any time so be prepared. 2581 is very significant price resistance and we hit 2579 on Tuesday. The declining 20 week EMA is another major test and you can see we're getting closer and closer to this level:
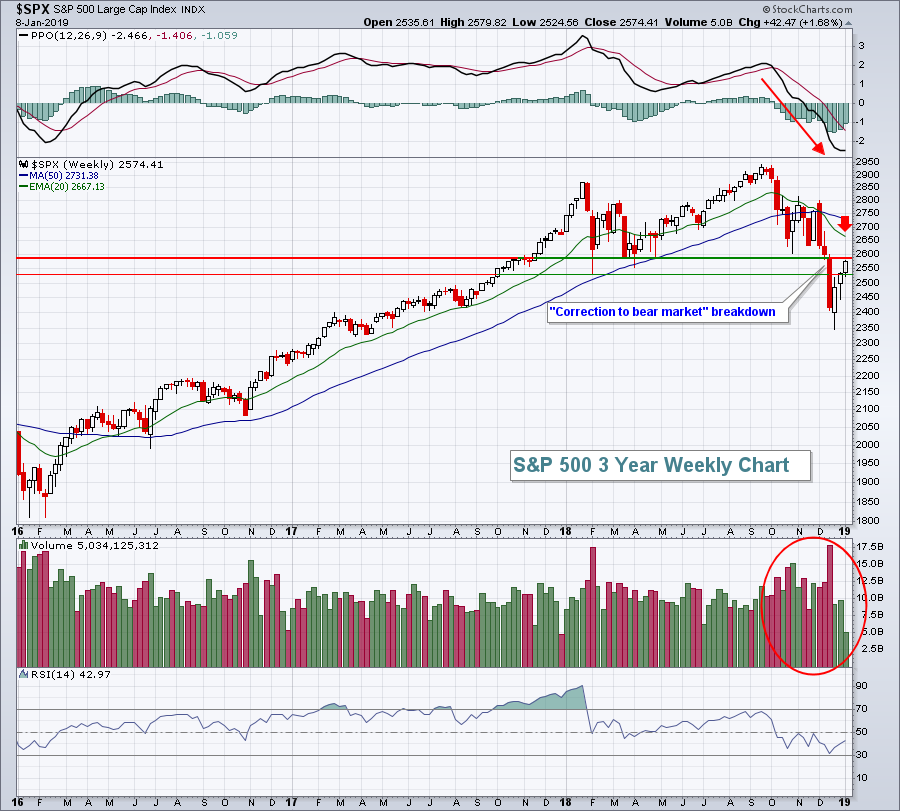 This rally has surprised many, but not technicians. We were extremely oversold at the recent bottom with a Volatility Index ($VIX) reading at 36. History tells us that a rally was in store and that's what we've seen. However, volume trends are extremely poor and the weekly PPO shows the sellers remain in control of momentum, despite the recent strength.
Real estate (XLRE, +1.74%) and communication services (XLC, +1.68%) were the Tuesday leaders. Mobile telecommunications ($DJUSWC, +2.53%) and media agencies ($DJUSAV, +2.25%) helped to lead the XLC and the latter has been one of the hardest groups to read over the past year. Big rallies are followed by big selloffs:
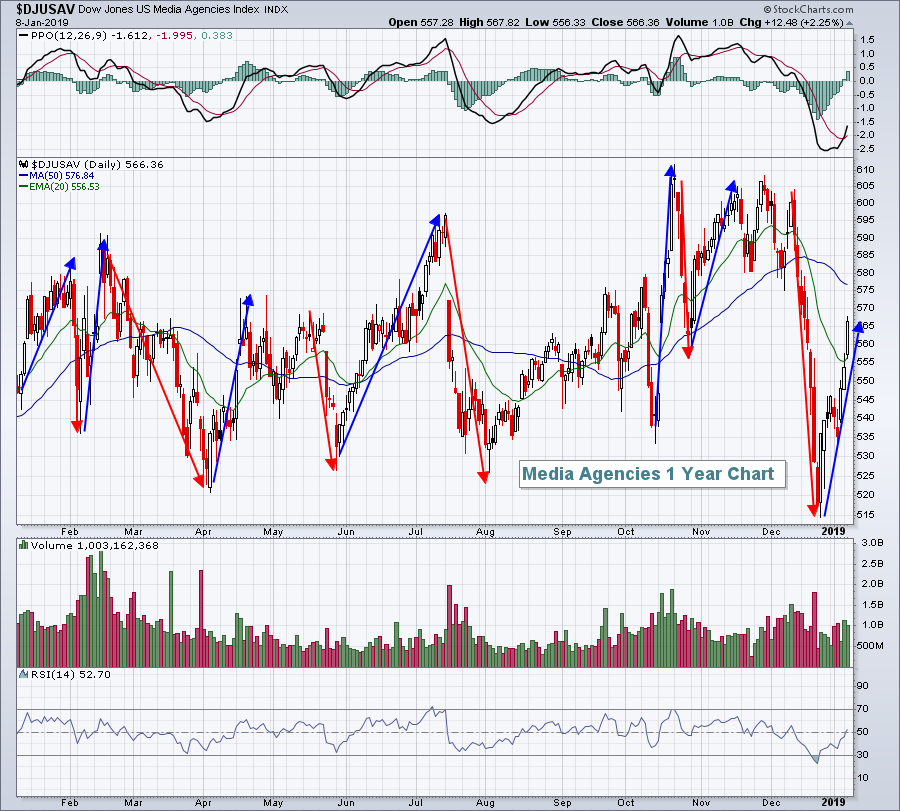 Chase rallies in this group at your own risk. The only question here seems to be "when will the next shoe drop?" The PPO has been a mess over the last year with momentum in both directions clearly unsustainable.
Two notable areas that did not participate in Tuesday's rally were financials (XLF, +0.08%) and semiconductors ($DJUSSC, -0.41%), which held back technology (XLK, +0.84%) in terms of relative performance. In the Sector/Industry Watch section below, you can see that the XLK has been struggling on a relative basis for quite awhile, yesterday was really nothing new.
Pre-Market Action
The 10 year treasury yield ($TNX) is up another 2.5 basis points to 2.74%. A rally in yields means falling treasury prices. The selling of treasuries results in proceeds available to be invested in equities. Therefore, as long as the TNX keeps rising, that's generally a bullish signal for U.S. stocks. Gold ($GOLD) is flat today, but I believe remains poised for a possible run to $1360-$1380 per ounce to test highs over the past few years - especially if the U.S. stock market rolls back over. Crude oil ($WTIC) is up nearly 3% this morning to $51.23 per barrel, in the middle of a key $50-$54 per barrel resistance range.
Global markets continued rallying overnight in Asia and this morning in Europe. Dow Jones futures are higher by 128 points with roughly 30 minutes left to the opening bell, poised to extend its rally. In the last 9 trading sessions, the Dow Jones has only seen significant selling one day - the day that Apple (AAPL) warned regarding its upcoming results.
Current Outlook
Transportation stocks ($TRAN) help to provide us clues about the state of our economy. A strong or strengthening economy should result in outperformance by transportation stocks. You can't sell more product without shipping it. A favorite relative ratio of mine is how the transports are performing relative to utilities ($UTIL). The latter is a defensive group. So if Wall Street believes our economy is strengthening, the TRAN:UTIL ratio usually rises. If the opposite is true, we'll see the ratio decline. This is where we currently stand:
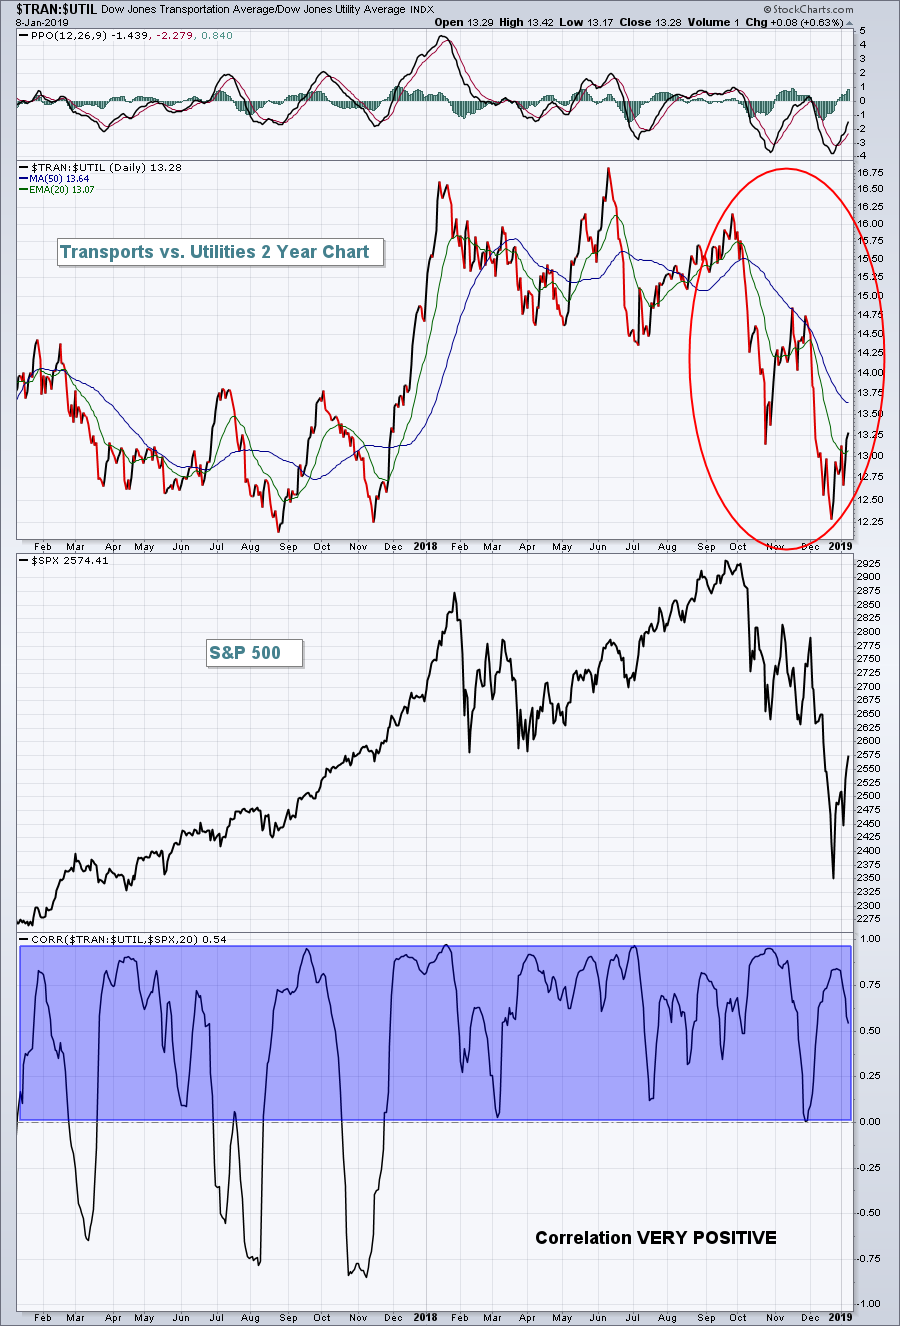 This ratio actually topped in June, but the real problems began in Q4, like so many other areas. Though the ratio is bouncing while the S&P 500 rallies, note where this ratio stood at the February low on the SPX vs. where it stands now. There's been significant rotation away from transports and into utilities and that could spell more trouble ahead for U.S. equities, at least in the first half of 2019.
Sector/Industry Watch
Technology stocks (XLK) were clear leaders throughout much of the bull market since the 2009 bottom. Investors and traders have been abandoning the group since the start of Q4 2018. Failure to break out on a relative basis multiple times over the summer of 2018 wore on the psyche of traders and certainly contributed to the Q4 massacre in U.S. stocks. Apple (AAPL), the leader, recently warned on its revenues for the first time in 17 years. Check out the chart:
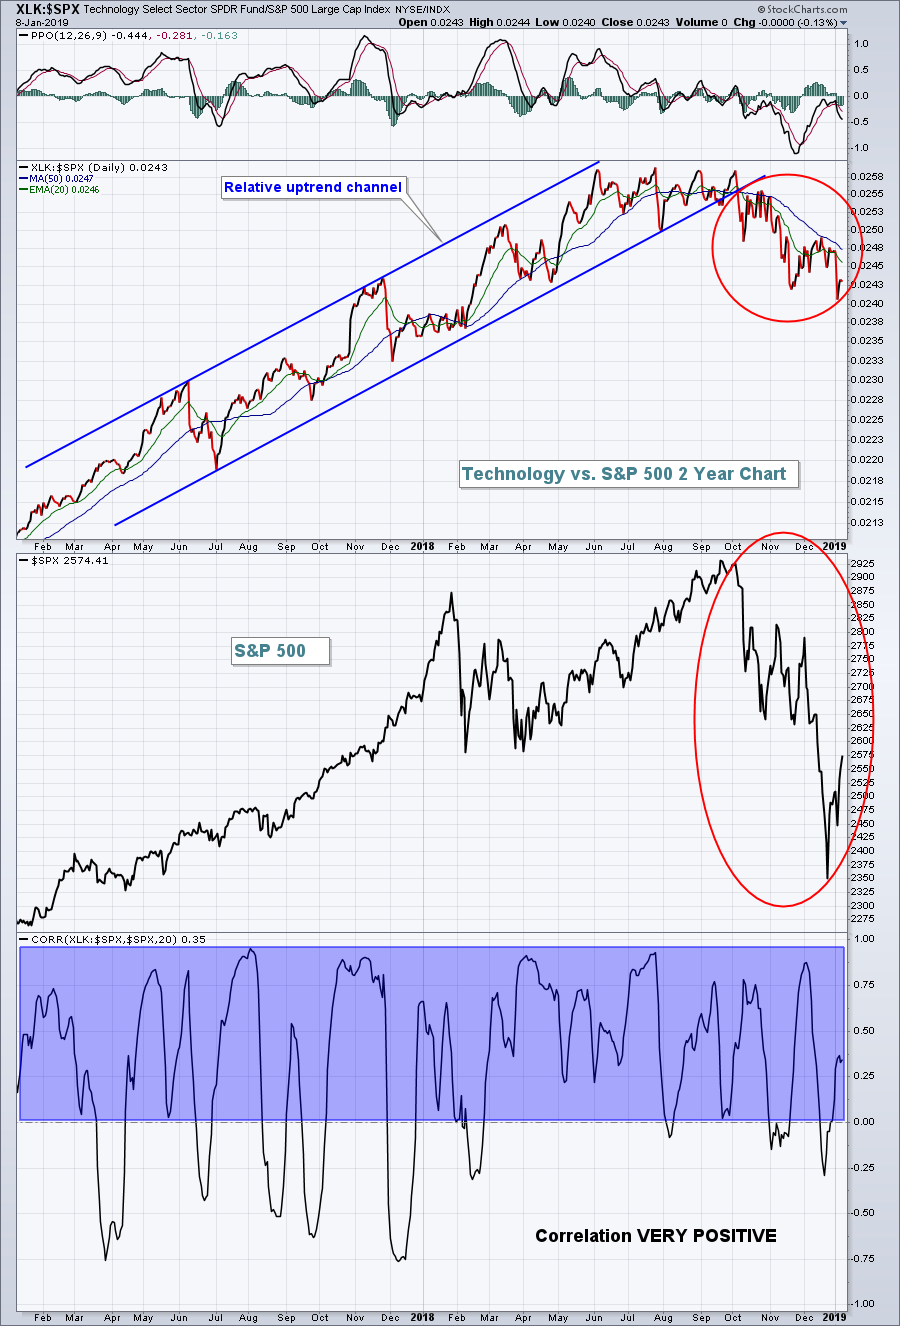 One big problem for the stock market going forward is that the current rally hasn't seen much relative strength in technology shares. The correlation coefficient at the bottom of the above chart highlights the fact that technology's relative strength (XLK:$SPX) has a very strong positive correlation to the direction of the S&P 500 overall. The lack of a bounce in technology relative strength is a major concern of mine during the current U.S. stock market rally.
Historical Tendencies
The 19th calendar day (all months, not just Janaury) ranks as the worst calendar day for the S&P 500 dating back to 1950. The annualized return for the 19th is -33.44%. The 9th calendar day is the second worst day for stocks as the S&P 500 has produced annualized returns of -17.19% on all 9ths. Today is January 9th. Before you rush out to sell everything at the open, understand that the S&P 500 has risen 296 times and fallen just 283 times on the 9th over the past seven decades, so it's been roughly a 50/50 proposition. Obviously, the percentage drops on the down days, however, have exceeded the percentage gains on the up days.
Key Earnings Reports
(actual vs. estimate):
LEN: 1.96 vs 1.91
STZ: 2.37 vs 2.04
Key Economic Reports
FOMC minutes to be released at 2:00pm EST
Happy trading!
Tom
