Market Recap for Monday, April 22, 2019
I'm sure you've noticed it at the pump lately. Gas prices are rising. Yesterday, crude oil prices ($WTIC, +2.31%) jumped to their highest level of 2019 and closed above $65 per barrel for the first time since breaking below key price support in early-November 2018. It's been one of many themes of 2019, and if you're a fan of the correlation coefficient, then you know that higher energy prices generally coincide with higher equity prices. Take a look:
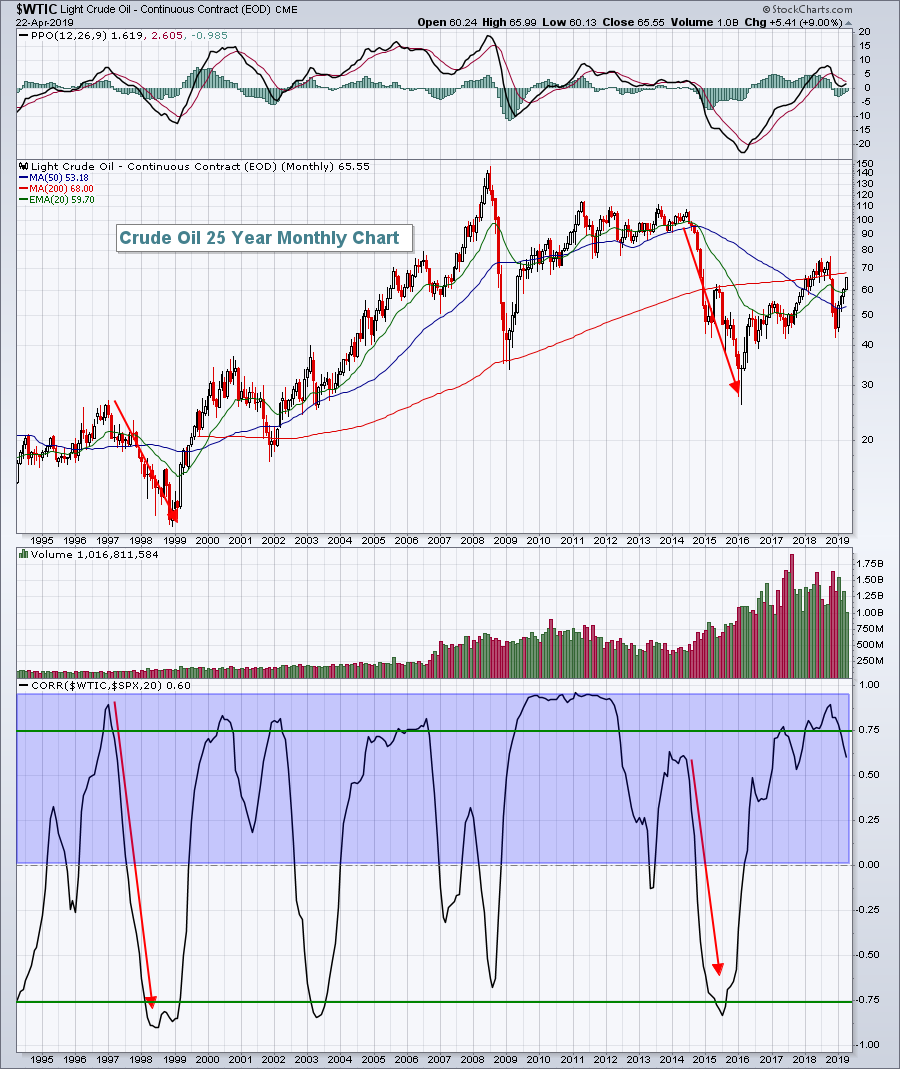 This is a 25 year look-back period. While we've seen periods of inverse (negative) correlation, two of those three inverse correlation readings beyond the -0.75 level resulted from rapidly-declining crude oil prices while equity prices were rising. Therefore, my conclusion is that falling crude prices may not necessarily result in falling S&P 500 prices, but rising crude oil prices (higher demand) is much more reliable in terms of predicting a rising equity market.
Energy (XLE, +2.11%) definitely provided leadership on Monday as the majority of sectors finished lower, including real estate (XLRE, -1.10%). The XLRE has dropped nearly 4% over the past week, although it did bounce off of critical short-term support as follows:
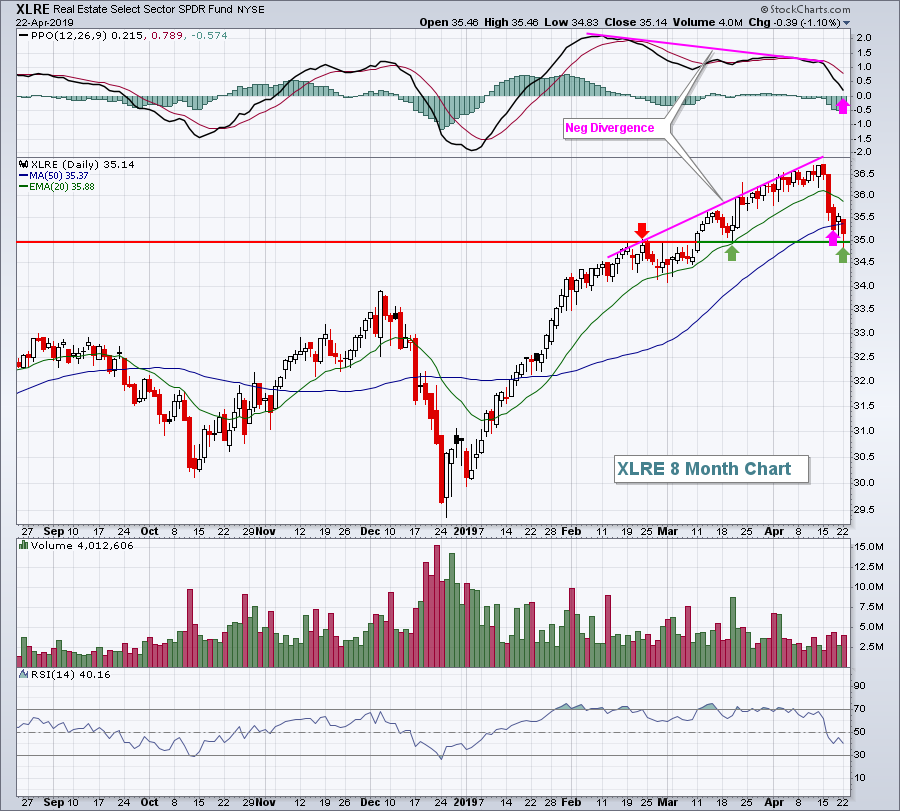 I'm not shocked at the recent weakness in the XLRE as I commented a month ago that there appeared to be a momentum issue here. But now that we've had a rough week to bring the PPO down near centerline support and short-term price support at 35.00 has been tested, I look for improvement here. A further drop and close beneath 35.00 would likely result in additional near-term selling.
Communication services (XLC, +0.45%) ended higher on Tuesday, led by the continually-improving internet space ($DJUSNS, +1.26%). I cover the DJUSNS in more detail in the Sector/Industry Watch section below as the group's relative strength is bullish and accelerating just as earnings season arrives. Look for solid earnings reports in this space over the coming weeks.
Pre-Market Action
Treasuries are relatively flat this morning, while gold ($GOLD) continues its descent. GOLD is at $1269 per ounce this morning, down another $8. Silver ($SILVER) is down twice as much on a percentage basis. Crude oil ($WTIC) is up slightly, currently setting a new 2019 high.
Asian markets were mixed overnight, as are European markets this morning.
Earnings season is really starting to kick in and most earnings thus far have beaten expectations. Strong earnings (see Key Earnings Reports section below) this morning are lifting U.S. futures as Dow Jones futures are higher by 46 points with 30 minutes left to the opening bell.
Current Outlook
Energy (XLE) has been rising and is in an established uptrend. However, it remains an "avoid" for me. Why? Relative strength. It's just not there, and its relative underperformance is likely to continue as long as the long-term trend for the U.S. Dollar Index ($USD) is higher. This charts says a thousand words:
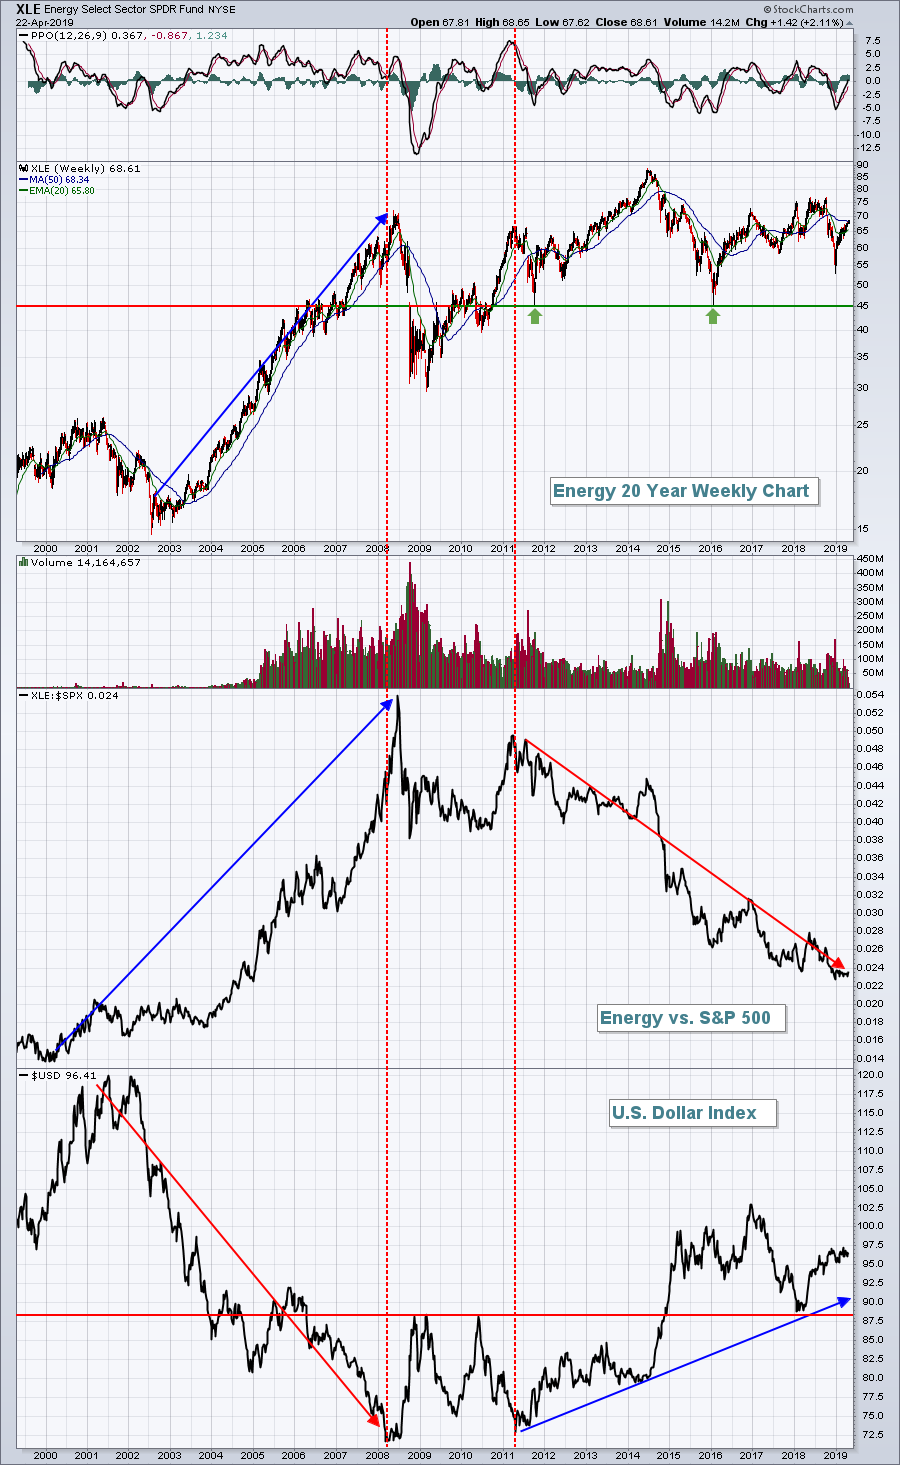 The "Energy vs. S&P 500" relative strength line has been dropping since 2011. The common denominator is that the USD has been rising throughout that period. It's undeniable that a stronger dollar pressures the relative performance of energy stocks. It doesn't mean that you can't make money in energy. It simply means you can make more money elsewhere. If I make 10% trading the XLE, while the S&P 500 has gained 20%, what have I really gained?
Sector/Industry Watch
Internet stocks ($DJUSNS) are outperforming the S&P 500 and that's all we really need to know. It's a group where you want to find representation in your portfolio. The following chart shows constant improvement in this group since November 2018. While the S&P 500 found its ultimate bottom in December 2018, we began to see relative strength in the DJUSNS one month earlier:
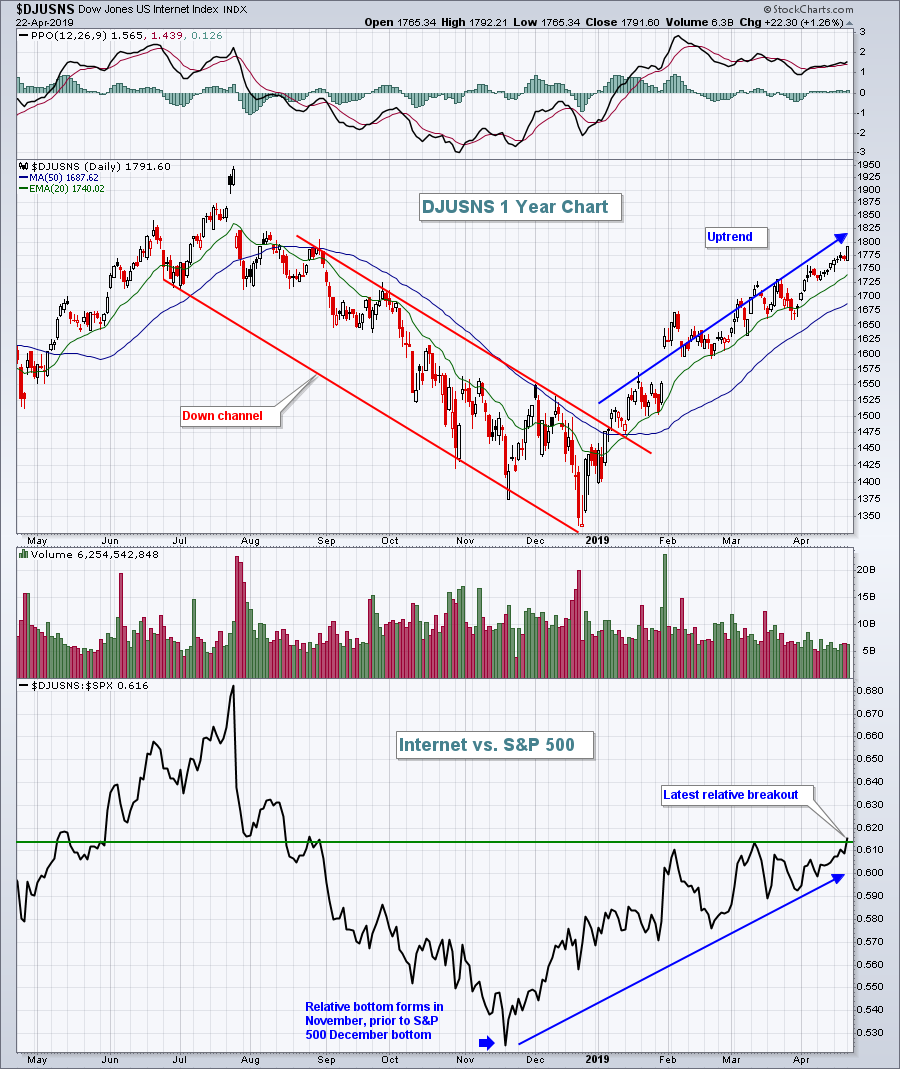 Internet stocks are very aggressive as their earnings can accelerate very quickly. Accordingly, it's always a bullish signal to see this group outperforming on a relative basis like they're doing in 2019.
Historical Tendencies
This can be a trying week historically as it's the week after options expiration. But solid historical performance is just around the corner. Late April into early May is typically very strong for U.S. equities. The following is the NASDAQ's daily historical performance for next week (since 1971):
April 29th (Monday): +54.84%
April 30th (Tuesday): +3.72%
May 1st (Wednesday): +106.20%
May 2nd (Thursday): +58.09%
May 3rd (Friday): -38.14%
May 4th and 5th have produced excellent results as well (+48.52% and +79.36%, respectively), although this year they fall on Saturday and Sunday. The point here is that once we move beyond this week, the bulls generally are quite happy.
Key Earnings Reports
(actual vs. estimate):
CNC: 1.39 vs 1.32
DGX: 1.40 vs 1.36
EDU: .69 vs .73
FITB: .63 vs .59
HAS: .21 vs (.08)
HOG: .80 vs .67
KO: .48 vs .46
LMT: 5.99 vs 4.29
NEE: 2.20 vs 2.01
NTRS: 1.48 vs 1.46
NUE: 1.55 vs 1.50
PG: 1.06 vs 1.04
PHM: .59 vs .47
PII: 1.08 vs .92
SHW: 3.60 vs 3.63
STT: 1.24 vs 1.19
TECK: .74 vs .73
TRU: .60 vs .59
TWTR: .09 vs .15
UTX: 1.91 vs 1.75
VZ: 1.20 vs 1.17
WAT: 1.60 vs 1.73
(reports after close, estimate provided):
AMTD: .93
CP: 2.25
CSGP: 2.44
CSL: 1.11
EBAY: .63
EW: 1.23
FE: .66
RHI: .96
SNAP: (.12)
SYK: 1.84
TER: .44
TSS: 1.16
TXN: 1.13
WRB: .61
Key Economic Reports
February FHFA house price index to be released at 9:00am EST: +0.4% (estimate)
March new home sales to be released at 10:00am EST: 645,000 (estimate)
Happy trading!
Tom
