Note
If you enjoy my daily blog articles, please subscribe (for FREE!) below. Simply scroll to the bottom of this article, type in your email address in the space provided and click the green "Subscribe" button. Once subscribed, my articles will be sent directly to the email address provided the moment my article is published.
Thanks!
Market Recap for Wednesday, April 24, 2019
Sellers in the final 20-30 minutes carried most of our major indices deeper into negative territory, although the small cap Russell 2000 showed relative strength for the second consecutive session, this time gaining 0.19%. The good news is that despite the relative weakness of small caps since late-February, it's holding above the relative low set in December:
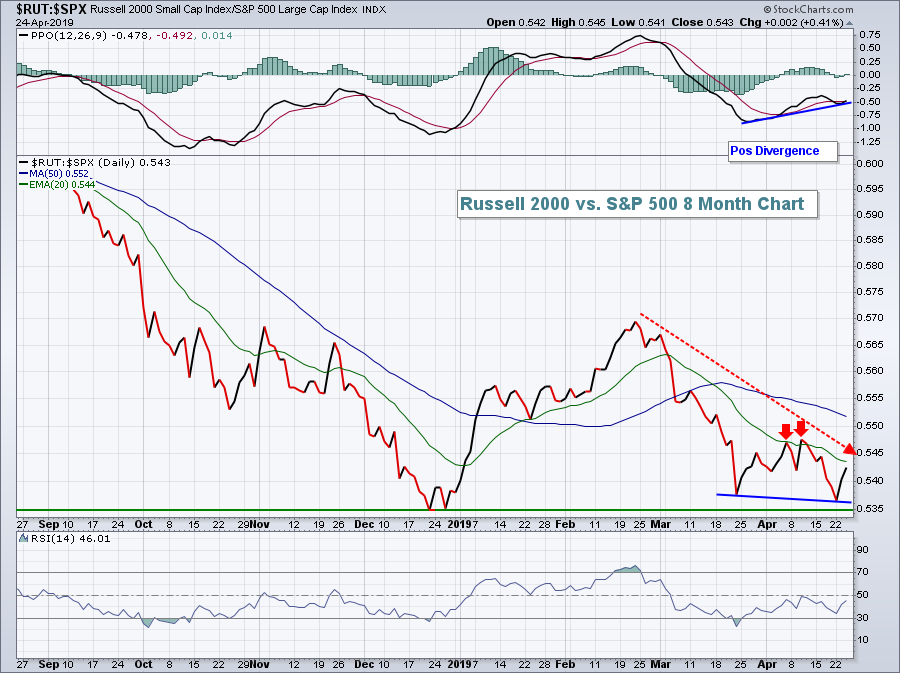 I think it's fairly important that small caps outperform from here. The red arrows highlight the failure to clear the falling 20 day EMA, so a first bullish step would be to do exactly that.
In addition to small cap leadership, real estate (XLRE, +0.70%) and utilities (XLU, +0.64%) - two defensive sectors - led on a relative basis as well. Because U.S. equities have rallied so far from the December low, it's not unusual to see leadership move to defensive stocks occasionally as the market catches its breath. What we wouldn't want to see would be an extended upside move and money rotate heavily from aggressive sectors to defensive sectors. That is not at all what we've been seeing as technology (XLK, +0.04%) and consumer discretionary (XLY, +0.09%) have been leading this rally on both an absolute and relative basis.
Energy (XLE, -1.75%) and materials (XLB, -0.62%) were the primary laggards on Wednesday, but as I've said many times, these two areas tend to underperform the benchmark S&P 500 during periods of a rising U.S. Dollar Index ($USD, +0.55%). The USD made a major breakout yesterday, so seeing the XLE and XLB perform so poorly should not be a surprise. I'd continue to avoid these two sectors for the most part.
Check out this USD breakout:
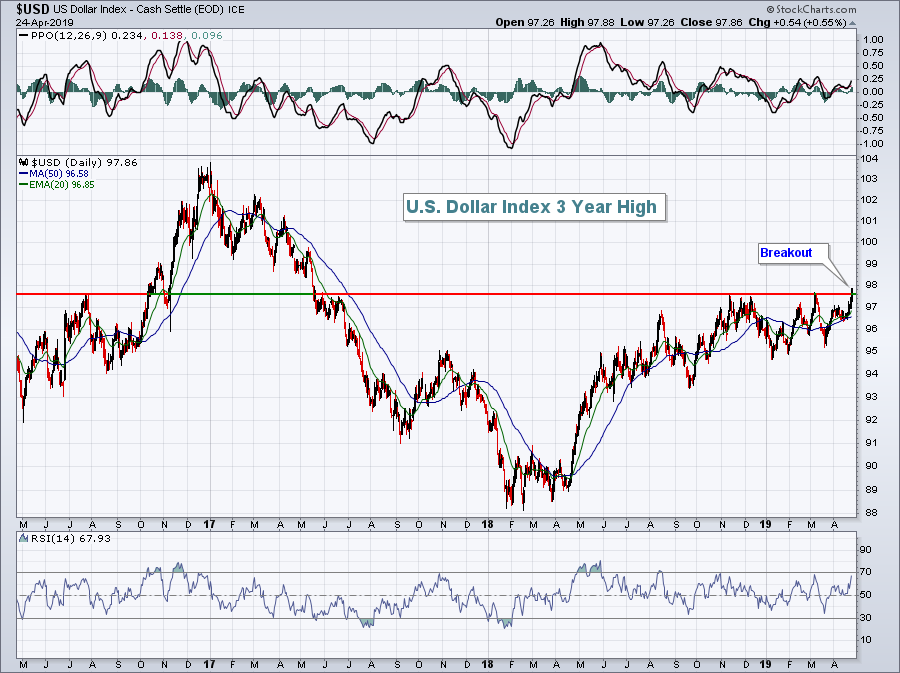 That's a high not seen in nearly two years. The ramifications for energy and materials are quite clear. They'll underperform if this USD rally continues. Consider adjusting your portfolio accordingly.
Pre-Market Action
Two prominent NASDAQ stocks, Facebook (FB) and Microsoft (MSFT), soared past quarterly earnings estimates and are solidly higher in pre-market action, gaining 8.9% and 4.7%, respectively. That will no doubt help the NASDAQ on a relative basis as it looks to move higher into record territory.
Treasuries, gold and crude oil are all hovering near their respective flat lines this morning after Asian markets were mixed overnight. We're seeing prevailing weakness in Europe this morning and that has carried over into the U.S., despite mostly better-than-expected earnings results.
Dow Jones futures are down 94 points as we approach the opening bell.
Current Outlook
Given the S&P 500's breakout on its hourly chart after testing its PPO centerline, I doubt we'll see an initial short-term pullback much below its 20 hour EMA. A steeper decline would be more likely after a negative divergence prints. Here's a look back at how hourly negative divergences have emerged and been resolved over the past 30 days:
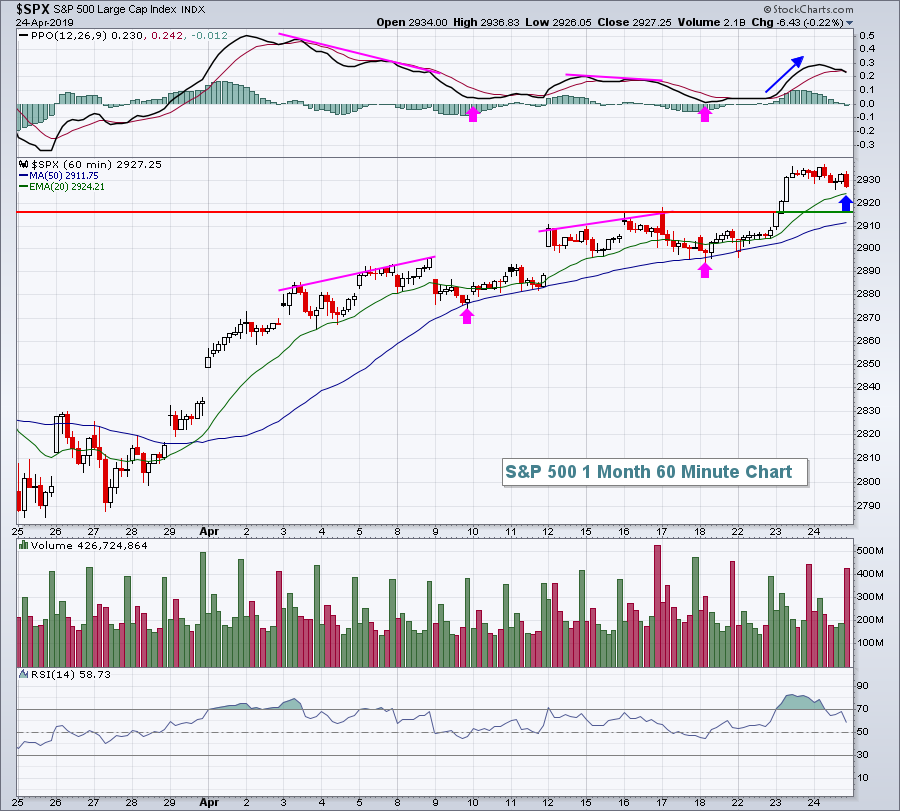 Based on the above, I don't see an end to the current rally just yet. Instead, let's watch to see how the hourly PPO reacts to fresh gains later this week or next.
Sector/Industry Watch
Industrials (XLI, -0.29%) didn't have a great day on Wednesday, but the group has had a solid month, trailing only financials (XLF) and consumer discretionary (XLY) over that period. Yesterday's failure to participate could have been nothing more than simply hitting overhead price resistance. We've seen technology (XLK) and XLY break out to new all-time highs recently and it appears that XLI is preparing to do the same:
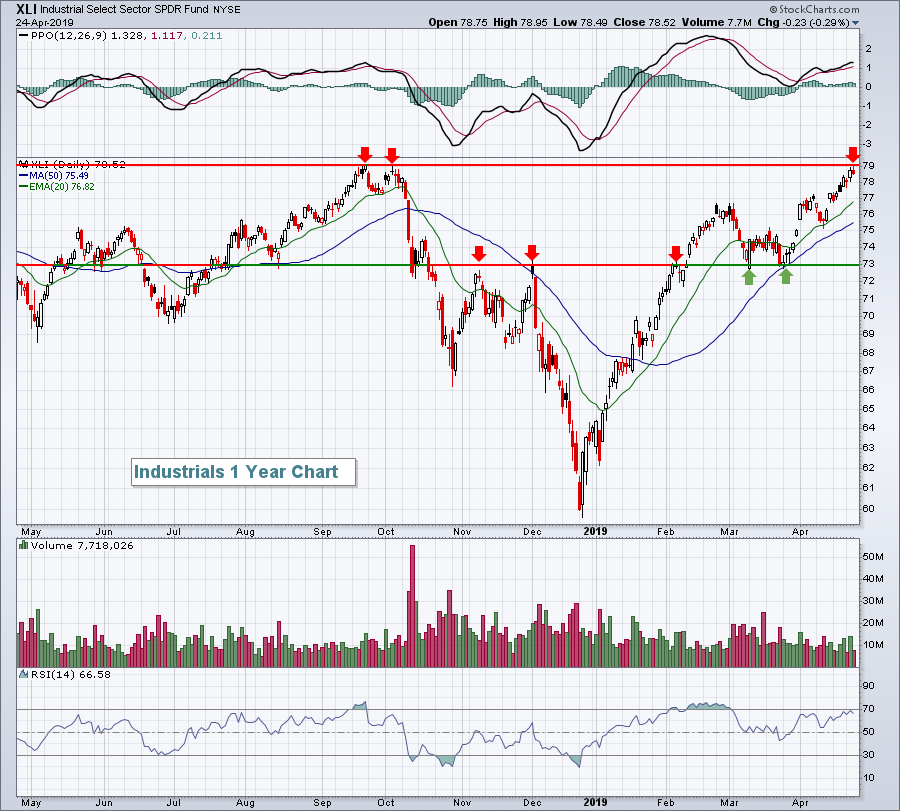 79 has clearly proven to be key price resistance. Intermediate-term price support is at 73 as that level is where we've seen multiple pivots on the chart. If the overall market pauses, I'd look for the XLI to perhaps drop to its rising 20 day EMA, currently at 76.82. However, the higher probability move is the breakout above 79 in my opinion.
Historical Tendencies
Next week is a strong period for the S&P 500 as it's produced annualized returns of +30.70% since 1950, more than tripling the S&P 500's average annual return of +9.0%.
Key Earnings Reports
(actual vs. estimate):
ABBV: 2.14 vs 2.06
AEP: 1.19 vs 1.10
ALLE: .88 vs .87
ALXN: 2.39 vs 2.19
BAX: .76 vs .68
BBD: .18 - estimate, awaiting results
BCS: .31 - estimate, awaiting results
BMY: 1.10 vs 1.09
BWA: 1.00 vs .94
CMCSA: .76 vs .66
CMS: .75 vs .77
DHI: .93 vs .86
ENTG: .50 vs .47
FCX: .05 vs .08
HBAN: .32 vs .32
HES: .09 vs (.26)
HSY: 1.59 vs 1.48
IP: 1.11 vs .91
IRM: .48 vs .53
IVZ: .56 vs .52
ITW: 1.81 vs 1.80
LKQ: .56 vs .55
LUV: .70 vs .61
MAS: .44 vs .47
MMC: 1.52 vs 1.45
MMM: 2.23 vs 2.50
MO: .90 vs .92
NEM: .33 vs .26
NOK: (.02) vs .03
ODFL: 1.64 vs 1.58
ROK: 2.04 vs 2.11
ROP: 3.30 vs 2.78
RTN: 2.77 vs 2.45
TAL: .20 vs .17
TSCO: .63 vs .56
UPS: 1.39 vs 1.42
VLO: .34 vs .20
WEC: 1.33 vs 1.25
WM: .94 vs .91
WST: .74 vs .66
XEL: .61 vs .61
XRX: .91 vs .85
YNDX: .27 vs .24
(reports after close, estimate provided):
ADS: 4.05
AEM: .05
AFL: 1.05
AJG: 1.61
AMZN: 4.61
BMRN: .09
CERN: .61
COF: 2.68
COLM: .84
CY: .24
DFX: 2.00
DLR: 1.65
EMN: 1.91
F: .26
FTI: .30
FTV: .68
GRUB: .25
IEX: 1.37
ILMN: 1.34
INTC: .87
JNPR: .21
MHK: 2.07
NOV: (.09)
PFG: 1.32
PKI: .66
RSG: .72
SBUX: .56
SGEN: (.33)
SIVB: 4.73
TMUS: .95
UHS: 2.60
VRSN: 1.24
Key Economic Reports
March durable goods released at 8:30am EST: +2.7% (actual) vs. +0.7% (estimate)
March durable goods ex-transports released at 8:30am EST: +0.4% (actual) vs. +0.2% (estimate)
Initial jobless claims released at 8:30am EST: 230,000 (actual) vs. 209,000 (estimate)
Happy trading!
Tom
