Market Recap for Wednesday, May 8, 2019
It was a much quieter day on Wall Street and it showed across our major indices and sectors. We finished with bifurcated action as the Dow Jones managed to finish with a minor 2 point gain. The other major indices ended with losses, led by the small cap Russell 2000, which fell 0.49%. It was a mixture of gains and losses on the sector leaderboard as utilities (XLU, -1.37%) was the obvious laggard. The remaining 10 sectors, however, either climbed or fell less than 0.25%. Healthcare (XLV, +0.21%) provided minor leadership, while three different sectors - energy (XLE), industrials (XLI), and real estate (XLRE) - closed exactly where they closed the prior day. I'm not sure if I've ever seen a day when three sectors have done that. It underscores the fact that Wall Street paused for a day - in these three cases quite literally.
The trade war remained the central issue and nervousness remained as the Volatility Index ($VIX, +0.08%) failed to retreat. That should keep all of us short-term traders on our toes as a VIX reading near 20 suggests more whipsaw action is likely right around the corner.
One stock that has simply can't find support since its IPO is Lyft, Inc. (LYFT). LYFT reported quarterly results for the first time since going public and the reaction wasn't nice. LYFT needs a lift:
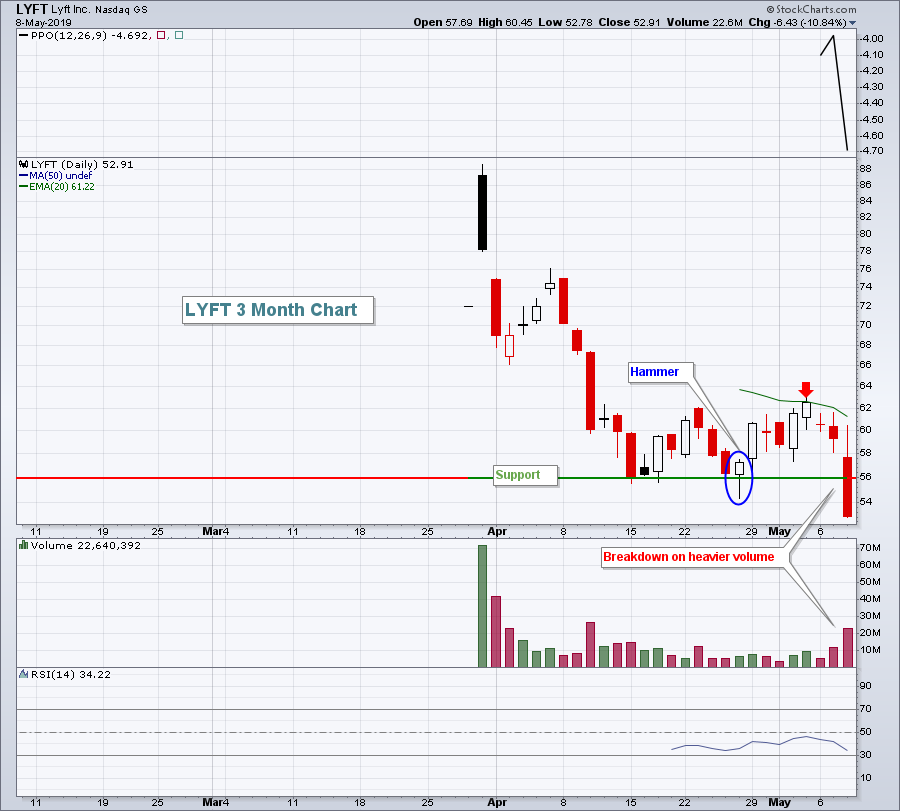 Uber's IPO is on deck. Taxi!!!
Pre-Market Action
With potential increased tariffs looming, U.S. stocks are in no mood for tough talk between the U.S. and China. Futures are once again reeling as the Dow Jones looks to possibly open down 200 points. That would challenge Tuesday's intraday low of 25,789. If that near-term price support is lost, it'll likely result in a new wave of sellers. Given the VIX recent surge, please be very careful as impulsive selling is a bull's biggest enemy. I simply say that market makers "go on vacation" and let prices fall precipitously. That's the environment we're facing right now. The stock market wants a trade deal to get this uncertainty behind us.
The 10 year treasury yield ($TNX) is down 4 basis points this morning to 2.44% in reaction to higher-than-expected initial jobless claims, little inflation at the producer level, and the renewed trade fears that could potentially damage an already-fragile global economy.
While U.S. stocks have suffered this week, it's China that's really taking the full impact of the trade punch. China's Shanghai Composite ($SSEC, -1.48%), with last night's losses, is now down approximately 12-13% over the last two weeks.
Dow Jones futures are down 225 points as we approach the opening bell.
Current Outlook
Given the higher VIX readings, I'm waiting to see positive technical developments on the hourly chart before I become bullish near-term. Thus far, hourly reactions have been quite bearish as you can see below:
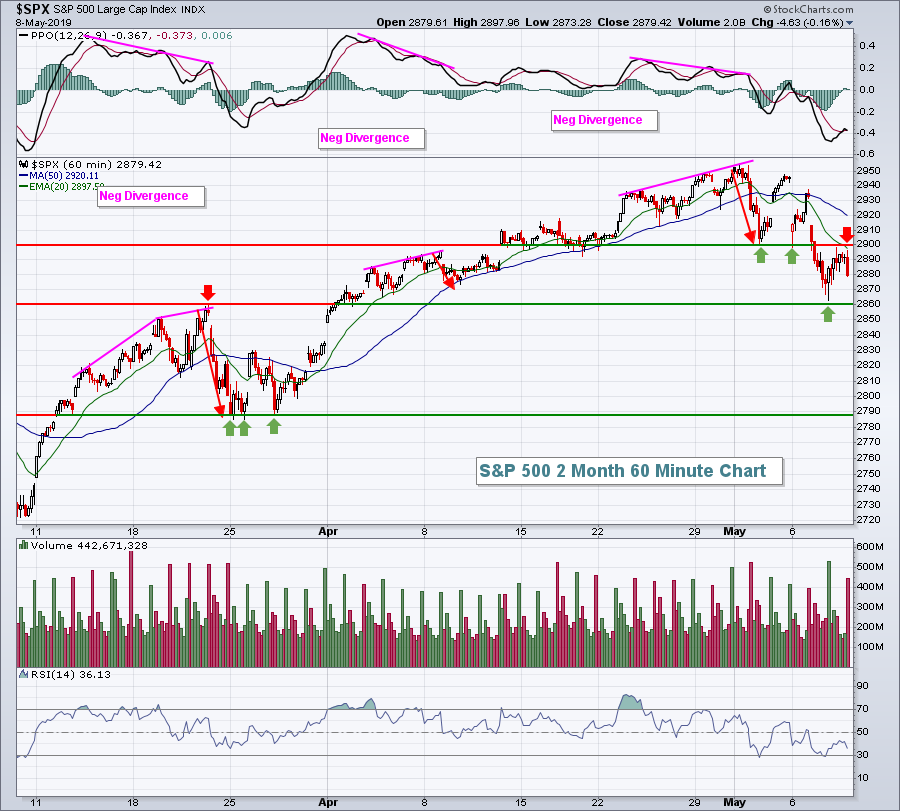 There was a price breakdown beneath support near 2900. Note yesterday's feeble attempt to test both the 20 hourly EMA and what's now key price resistance at that 2900 area. That's not a good sign at this point and underscores the need to be cautious if you're a shorter-term trader.
Sector/Industry Watch
Utilities (XLU) typically provide us a bit of cushion during selloffs and that may be true again in the very near-term. But the XLU did break down beneath its 50 day SMA for the first time since January and it did lose short-term price support near the 57.20 level:
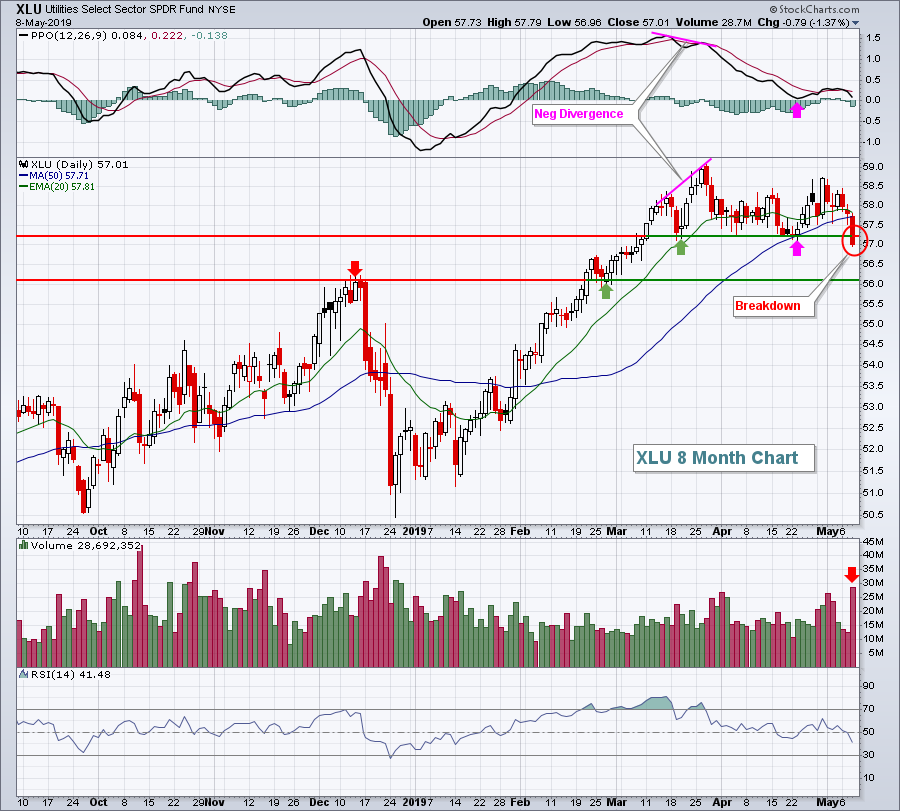 The late-March high was accompanied by a negative divergence. When I see that print on a chart, it warns me of a potential failure to hold 20 day EMA support and to "reset" the PPO at centerline support with potentially a 50 day SMA test as well. That's exactly what we saw over the next 2-3 weeks as the pink arrows above highlight. But the breakdown beneath the double bottom on increasing volume now tells us that we could see further selling. The obvious price support level to look for is just above 56.
Historical Tendencies
I posted recently that U.S. equities struggle during the middle part of May (May 6-25) historically with negative annualized returns (-11.95%) since 1950 on the S&P 500. In addition to weak historical returns, the odds of a given day within this period advancing drops fairly significantly. Overall, the S&P 500 has moved higher 53.33% of all days over the past six decades. In this May 6-25 period, that percentage drops to 48.92%.
Key Earnings Reports
(actual vs. estimate):
AEE: .78 vs .70
BDX: 2.59 vs 2.57
CAH: 1.59 vs 1.43
CNP: .46 vs .50
CNQ: .53 vs .39
DUK: 1.24 vs 1.21
ELAN: .25 vs .22
KDP: .23 - estimate, awaiting results
LNG: .54 vs .26
MGA: 1.63 vs 1.73
MT: .53 vs .88
NCLH: .83 vs .71
TTD: .49 vs .25
TU: .55 - estimate, awaiting results
(reports after close, estimate provided):
BKNG: 11.26
DBX: .06
EFX: 1.19
MTD: 4.06
NTR: .24
SYMC: .39
VALE: .53
WYNN: 1.59
Key Economic Reports
Initial jobless claims released at 8:30am EST: 228,000 (actual) vs. 215,000 (estimate)
April PPI released at 8:30am EST: +0.2% (actual) vs. +0.3% (estimate)
April Core PPI released at 8:30am EST: +0.1% (actual) vs. +0.2% (estimate)
Happy trading!
Tom
