Market Recap for Monday, August 5, 2019
It was a very bad day on Wall Street with our major indices having their worst day of 2019. Panic is setting in as the U.S. and China shoot trade war bullets back and forth at each other. China's Shanghai Composite ($SSEC, -1.56%) closed below its 200 day SMA overnight, its lowest level since February. China's currency hit a low not seen in over a decade as they attempt to offset the shots fired by the U.S. by keeping its currency artificially low. China also said its companies agreed to suspend agricultural purchases from the U.S. One thing is really obvious to me. The bond market, which is a safe haven during volatile periods, has seen its yields tumble and that is sending a very, very strong message to the Fed that they'll need to be extremely accommodative for at least the balance of 2019, something the Fed has yet to acknowledge. The "transparency" that prior Fed Chairs Bernanke and Yellen fought so hard to develop is currently MIA with this Fed. And the stock market is not happy.
While all of our major indices fell around 3% (the NASDAQ was a bit higher at 3.47%), all of the major sectors also shed at least 1%. Technology (XLK, -4.17%) was hit the hardest as that's a group that stands to lose quite a bit with an ongoing trade war, especially computer hardware ($DJUSCR, -5.09%) and semiconductors ($DJUSSC, -4.27%). Financials (XLF, -3.33%) tumbled as well with the 10 year treasury yield ($TNX) literally in near free-fall mode. The last time we saw yields tumble in November-December 2018, the Fed adamantly remained hawkish and panic kicked in, driving the S&P 500 to that December 26th intraday low.
Hopefully, the Fed has learned from that episode, but I doubt it. I have little confidence in this Powell-led Fed. In my opinion, the Fed remains perhaps the biggest threat to the current secular bull market.
Pre-Market Action
Wall Street is in a better mood this morning as U.S. futures are pointing to a higher open. But any time we're in an obvious downtrend with high levels of emotion, it's easy to question the sustainability of a rally. I'll need to see much more than bright green futures.
With roughly 15 minutes left to the opening bell, Dow Jones futures are higher by 215 points.
Overnight, Asian markets were roughed up a bit, with the China Shanghai ($SSEC) falling to a 6 month low and breaking support near 2825. We're seeing much better action in Europe, especially on the German DAX ($DAX), which is bouncing off very critical price support near 11,650. That also coincides with its 200 day SMA.
Current Outlook
I know the question that immediately surfaces when we see a bout of selling. Where's the bottom? Well, if we knew that answer with precision, it would be really easy to make money in stocks. But the combination of market unpredictability and human emotion makes answering that question one of the most difficult. The stock market acts irrationally during selloffs because people panic. It's that simple. Unfortunately, it's like a mud slide. It's hard to stop until it exhausts itself. That normally occurs with extreme volatility ($VIX) readings. See the Sector/Industry Watch section for more on this. Here's a daily chart of the S&P 500 and where there's obvious price support:
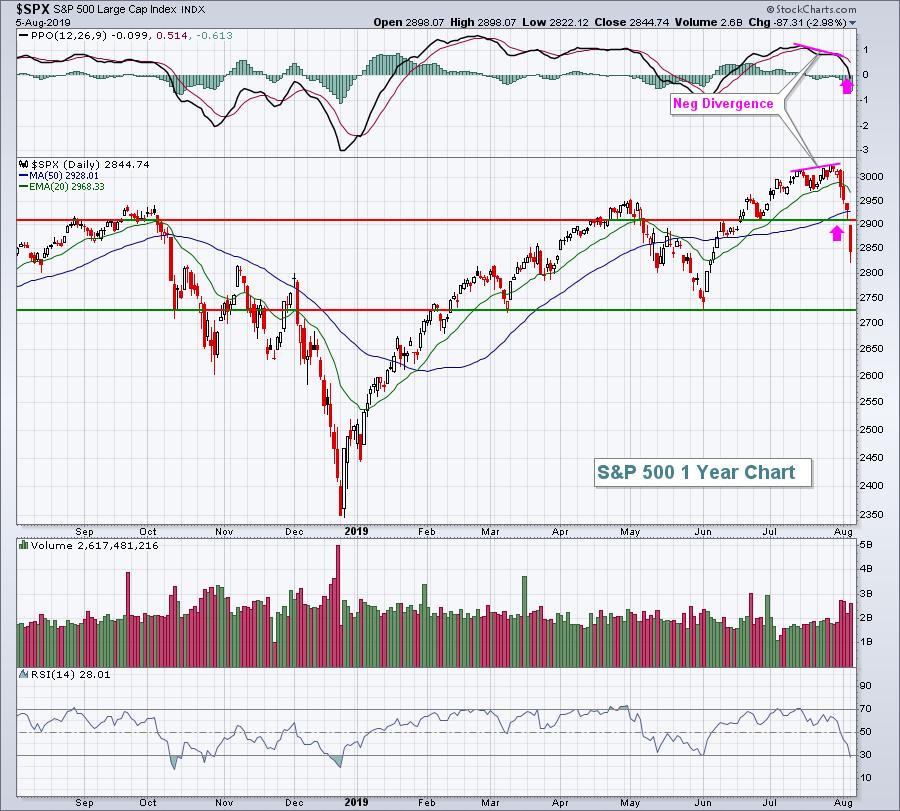
There was fairly solid short-term price support at 2900, but we gapped beneath that level on yesterday's open, so buyers at that level never had an opportunity to buy. Next up, and what I believe is an important psychological level, is roughly 2725 or so. We've seen a double bottom there. A close beneath on heavy volume would likely spur much more panicked-selling.
To the upside, closing back above 2900 would be a bullish start, but ultimately I want to see the S&P 500 back above both its 20 day EMA and that 2900 level.
Sector/Industry Watch
Markets panic and, when they do, reality is tossed right out the window. Forget about great earnings, moving averages, trendlines, and sometimes even major price support. Panic sees no support....until panic hits an extreme. Extreme panic can be measured on charts in a couple ways - by the Volatility Index ($VIX), which is a measure of expected volatility, and by the equity only put call ratio ($CPCE), which measures the sentiment of retail option traders. When these two reach extreme levels, we can begin looking for a significant bottom:
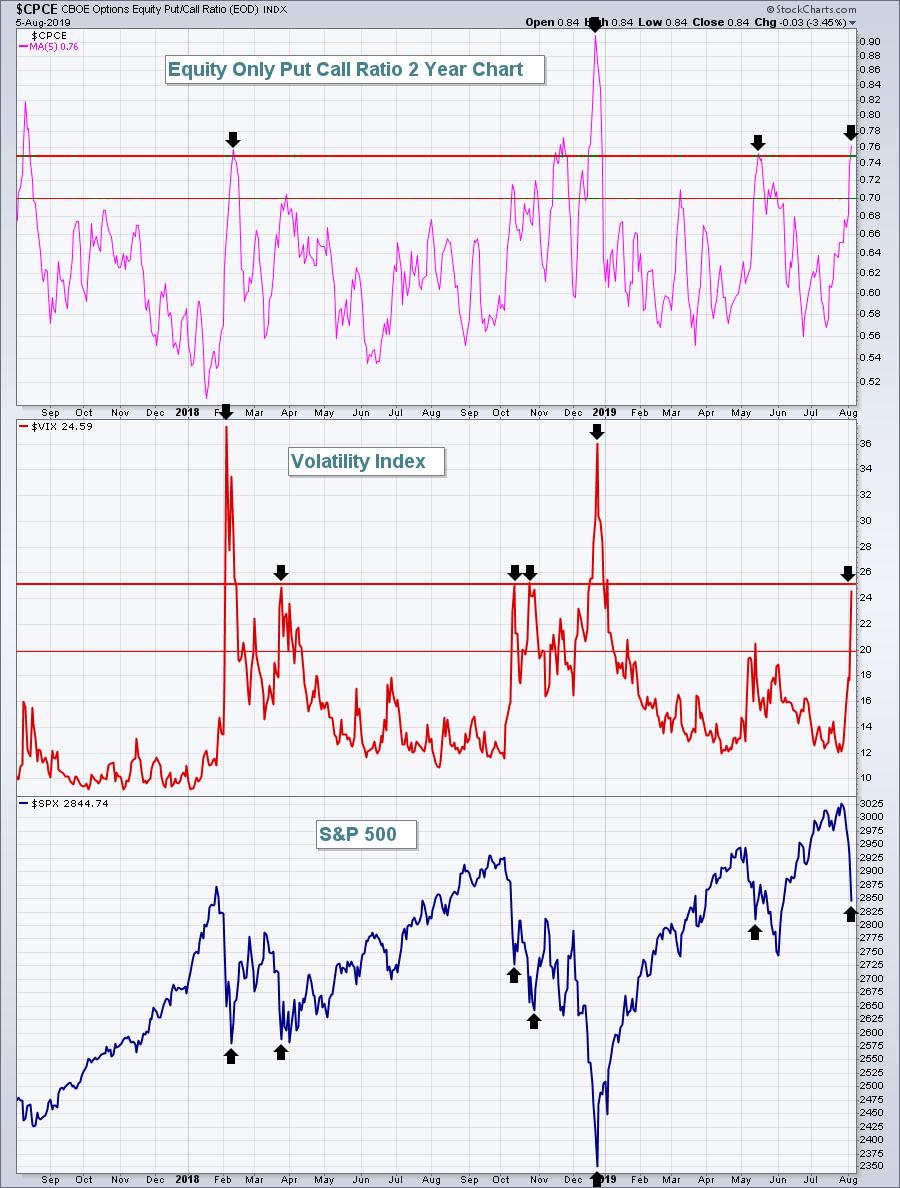
Sentiment is reaching key levels, which is a good thing. But it also means the stock market is extremely emotional right now, so be very careful. Futures are pointing up today, but if we move into negative territory intraday and fail to hold Monday's intraday low, I'd expect to see the fear ramp up to another level. During secular bull markets, MAJOR BOTTOMS form when the VIX hits extreme readings in the mid-30s. Everyone wants to catch the exact bottom, which is wonderful if we can do that. But timing it perfectly is like trying to hit your number in roulette. Don't forget the risks involved if you're wrong. I'd keep position sizes smaller for now. Limit your risk.
Historical Tendencies
J.B. Hunt Transport Services (JBHT, -4.69%) took a big hit yesterday, but it's not unusual for this transportation stock to run into August difficulties. Check out its history over the past two decades:
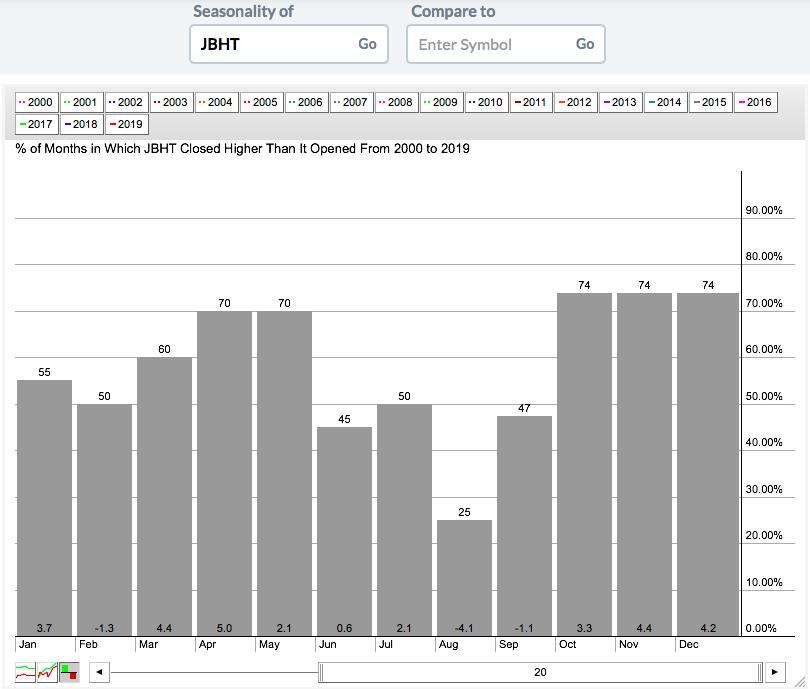
August is clearly a major outlier. JBHT has moved higher during Augusts only 25% of the time and its average August return over 20 years is -4.1%. That could be problematic, especially if the recent overall market selling continues.
Key Earnings Reports
(actual vs. estimate):
AES: .26 vs .27
AGN: 4.38 vs 4.34
ARMK: .47 vs .45
AVTR: .14 vs .17
BDX: 3.08 vs 3.05
BKI: .49 vs .48
DISCA: .98 vs .99
DISCK: .98 vs 1.35
DUK: 1.12 vs .98
EMR: .94 vs .94
EXPD: .80 - estimate, awaiting results
FIS: 1.78 vs 1.78
HSIC: .84 vs .83
MOS: .12 vs .30
REGN: 6.02 vs 5.42
SERV: .50 vs .47
TDG: 4.95 vs 4.31
WLK: .92 vs .84
ZTS: .90 vs .82
(reports after close, estimate provided):
AFG: 2.01
DIS: 1.76
DVN: .36
FANG: 1.74
FLT: 2.79
GH: (.34)
HST: .54
HUBS: .25
MCHP: 1.38
MTCH: .45
PAA: .44
PLNT: .41
PPL: .56
PXD: 1.88
WTR: .39
WYNN: 1.42
Y: 9.48
Key Economic Reports
None
Happy trading!
Tom
