Market Recap for Tuesday, August 6, 2019
Ok, let's start with the good news. Our major indices all finished higher on Tuesday, rebounding from their worst day of 2019. Every sector except energy (XLE, -0.12%) finished the day higher and our 5 aggressive sectors were the 5 leaders with technology (XLK, +1.66%) and financials (XLF, +1.61%) the best of the group. Retailers rebounded a bit as footwear ($DJUSFT, +2.83%) and apparel retail ($DJUSRA, +2.39%) led consumer discretionary (XLY, +1.52%). The DJUSRA showed absolute strength yesterday, bouncing off key support, but its relative strength is problematic. See the Sector/Industry Watch section for more information there.
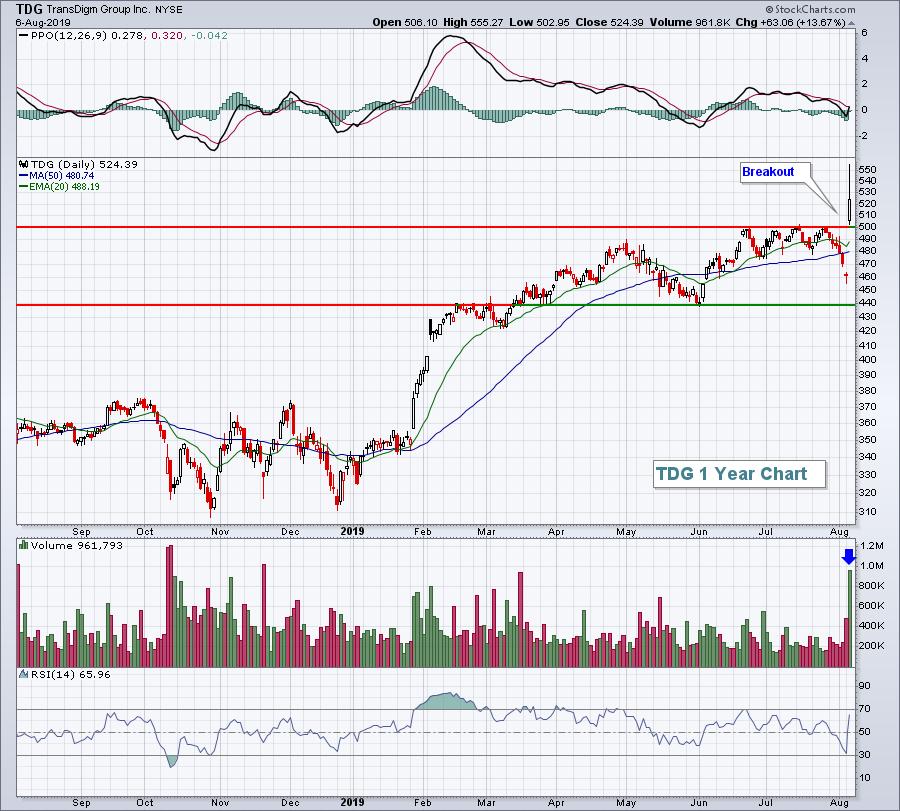
On a stock-by-stock basis, we definitely saw some winners. The best performing stock in the S&P 500 was Transdigm (TDG, +13.61%), which easily beat both revenue and EPS estimates and soared on heavy volume to clear key overhead price resistance:
There are definitely areas and stocks showing strength, but fear is ruling this market. The Volatility Index ($VIX, -17.97%) tumbled yesterday, but still finished just above 20. ANY VIX READING ABOVE 20 SHOULD CAUSE CONCERN. And we're likely to feel the effects of it once again today. The market is very, very nervous thanks to an absolutely horrific Fed. If you don't believe me, simply look at the bond and stock market's reaction in December 2018, May 2019 and last week after 3 gaffes. Bond yields and stock prices have both gone in the tank. The Fed needs to reconsider its strategy and quickly begin to provide the transparency that our financial markets have grown to demand....or else....
Pre-Market Action
One shocking development over the past week has been the massive decline in the 10 year treasury yield ($TNX) following the Fed's lack of transparency during its latest FOMC policy statement. The bond market is making the decision for the Fed. This morning, the TNX has fallen another 11 basis points to 1.63%. Unbelievable! A rapidly-declining TNX means that money is absolutely POURING into treasuries. That makes it nearly impossible for the stock market to make any headway. It shouldn't be too surprising to see Dow Jones futures down 270 points as we approach a new trading session.
Fear is playing perfectly into the hands of gold ($GOLD), which is up another $23 per ounce and is now above $1500. GOLD performs very well when the U.S. Dollar Index ($USD) is under pressure or when fear ramps up. Clearly, the latter is benefiting GOLD.
Asian markets were slightly lower overnight, while European markets are currently higher.
Current Outlook
Clearly, we've seen technical damage in the short-term given the selling that's taken place over the past week. It's typically not easy to repair that damage and there will be key overhead price, gap and moving average resistance levels to watch closely. I'll break those down on an hourly chart, but don't lose sight of the 20 day EMA on the daily chart. It's currently at 2960 and will continue declining rather rapidly. If we do see considerable short-term strength and break above key short-term levels identified below, that 20 day EMA will be very important on the daily chart. Ok, here's where I'll be watching on the S&P 500 hourly chart:
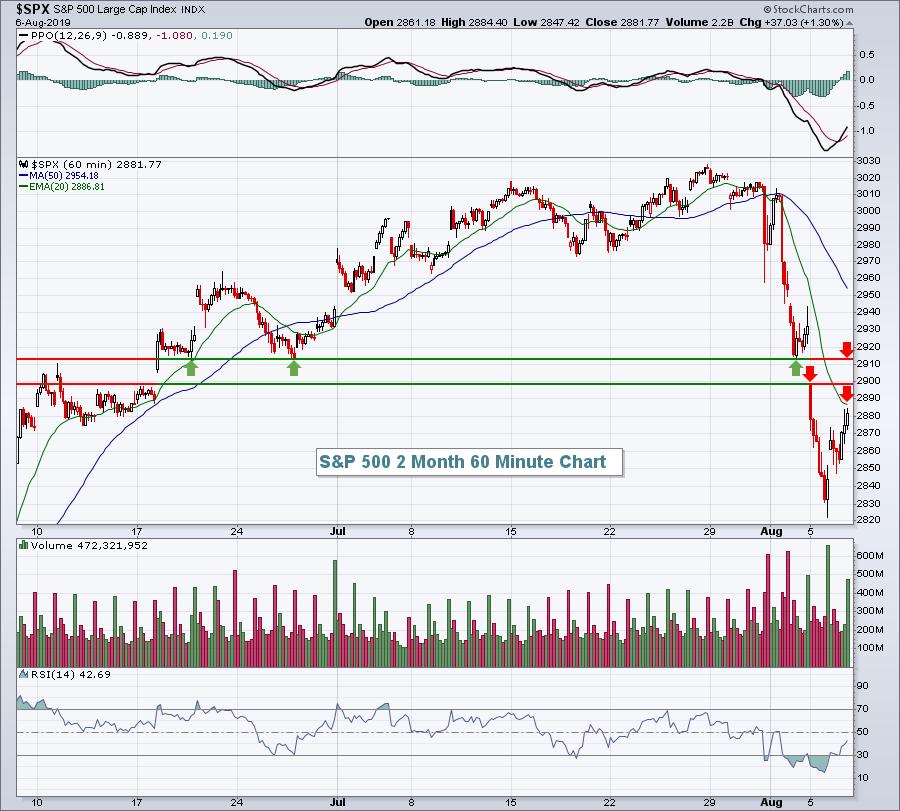
The three green arrows show that price support held in the 2911-2914 area on three separate occasions. That could be a difficult area to negotiate. There are likely to be sellers at the bottom of gap resistance at 2898 and then there's the declining 20 hour EMA, currently at 2886. Let's see if any strength can carry us through those levels. If so, then we can move to the daily chart and see if the 20 day EMA can be cleared. I believe the most likely direction is at least a test of the recent price low, perhaps a break beneath it to establish a final short-term bottom. My long-term analysis has not been swayed at all by this current selling. It happens and it will continue to happen. We remain in a secular bull market.
Sector/Industry Watch
The widely diversified retail ETF (XRT, +1.27%) found support and bounced from its late-May low. While that may appear on the surface to be a bullish development, we always need to look further. Relative strength, or in this case relative weakness, tells us a different story:
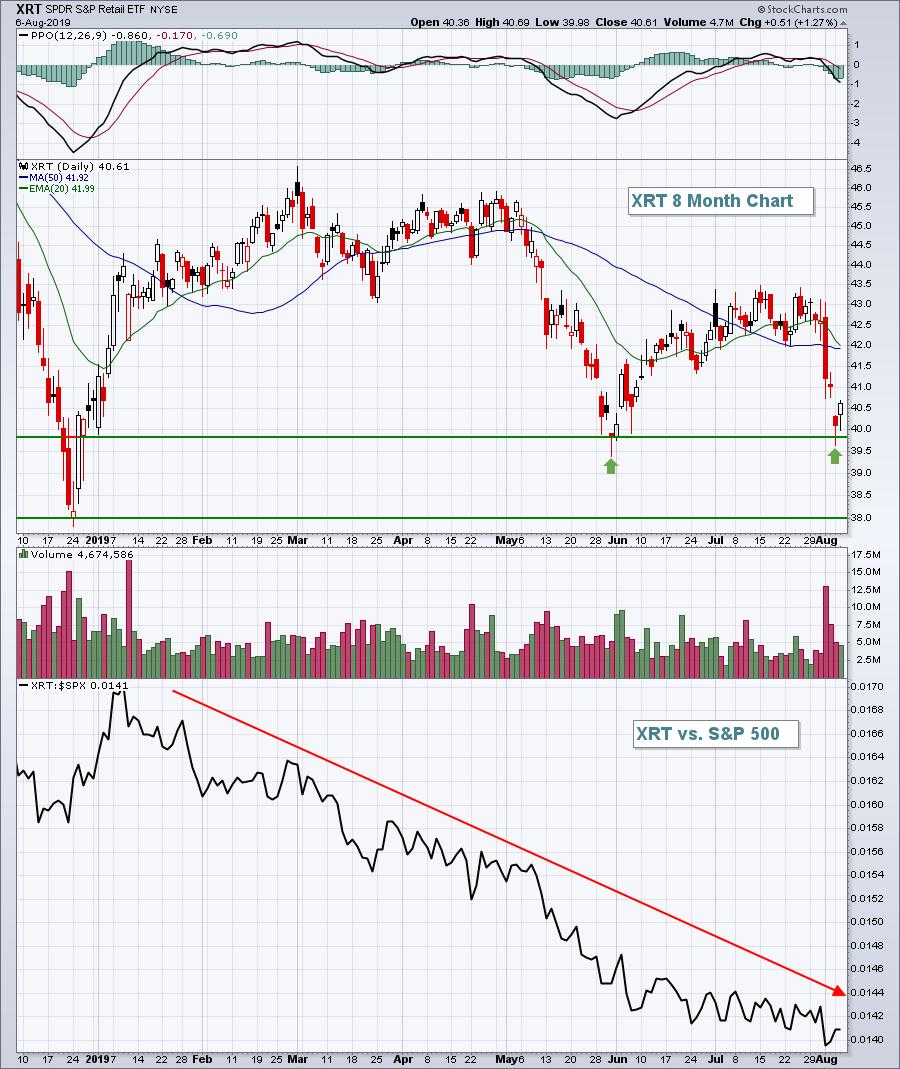
Those two green arrows show that buyers returned exactly where they were two months ago. The problem, however, is that retail continues to weaken vs. the broader market. That tells us it will be more difficult to outperform the S&P 500 if we own retail stocks. If you do own retail stocks, check your stock's relative strength vs. the S&P 500. If it's not going up, I'd likely switch to one that is.
Historical Tendencies
Gap, Inc. (GPS) is part of an apparel retail group ($DJUSRA) that has been languishing vs. the S&P 500. GPS has been a very weak component of this industry group and, if it's looking to gain strength from history, it better look again. August and September have been very poor months for GPS as you can see below:
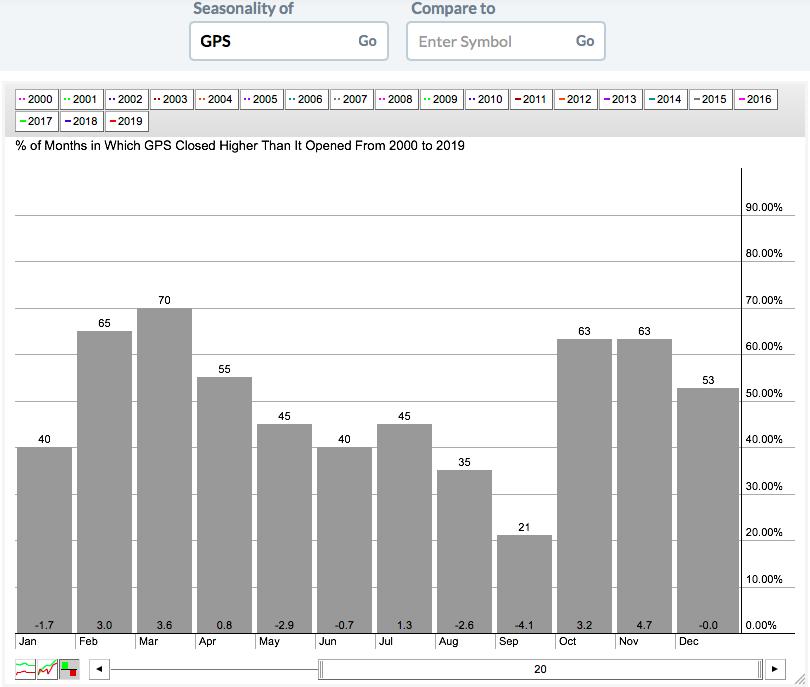
While we can't expect too much from GPS as we bring summer to a close, Q4 tends to start off extremely strong as GPS has averaged gaining 3.2% and 4.7% during October and November, respectively.
Key Earnings Reports
(actual vs. estimate):
ATHM: 1.04 vs 1.03
CNP: .35 vs .31
CVS: 1.89 vs 1.70
CYBR: .59 vs .47
INXN: .11 vs .16
IONS: (.01) vs (.27)
LAMR: 1.54 vs 1.66
MIDD: 1.70 vs 1.77
STWD: .52 vs .52
TEVA: .60 vs .58
VER: .18 vs .17
(reports after close, estimate provided):
AIG: 1.17
ALB: 1.41
ANGI: .02
ATO: .69
AVLR: (.11)
AZPN: 1.08
BKNG: 22.80
CABO: 7.76
CTL: .31
CVNA: (.39)
DOX: 1.11
ET: .36
EVRG: .60
FNV: .31
FOXA: .59
G: .47
GLPI: .85
IAC: .92
LBTYA: .39
LYFT: (1.03)
MELI: .28
MFC: .55
MNST: .56
MRO: .11
NTES: 2.29
RGLD: .48
ROKU: (.22)
SRPT: (1.08)
SWKS: 1.34
TRIP: .52
UHAL: 8.14
ZG: (.15)
Key Economic Reports
None
Happy trading!
Tom
