It took a couple of big days to get the Dow back above the 10,400 level but last week's reaction rally has managed to do the trick and allowed the Dow to finish at 10,471. But will it last? The technical signs aren't convincing:
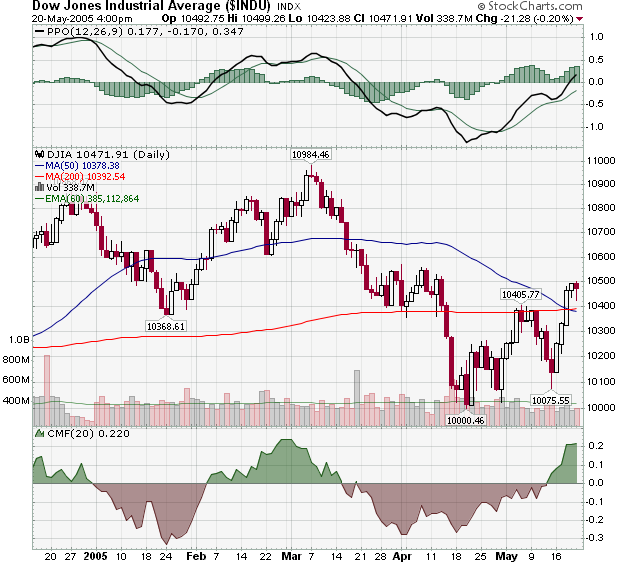
With Friday's weak close, declining volume and the 50-day moving average moving below the 200-day moving average, things are primed for a quick re-test of the 10,400 level. On the positive side, the MACD and Chaikin Money Flow indicators are still rising. It should make for a very interesting week coming up.
Let's see what our other commentators think...
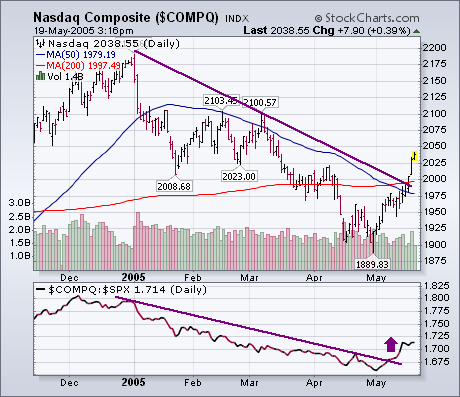
In my view, the most significant improvement has taken place in the technology-dominated Nasdaq market. The Nasdaq Composite Index broke through its 200-day average on Tuesday and has broken its 2005 down trendline. Its relative strength line has turned up relative to the S&P 500 . That's usually a positive sign for both. Nasdaq leadership is essential in any market upturn. That's what we're getting right now. One of the missing ingredients in recent market bounces has been higher volume . Yesterday's market upturn, however, saw all the major averages exceed their normal daily volume. That's a sign that institutions are starting to buy back into the market with more enthusiasm. The Nasdaq now appears headed toward its February/March peaks near 2100 .
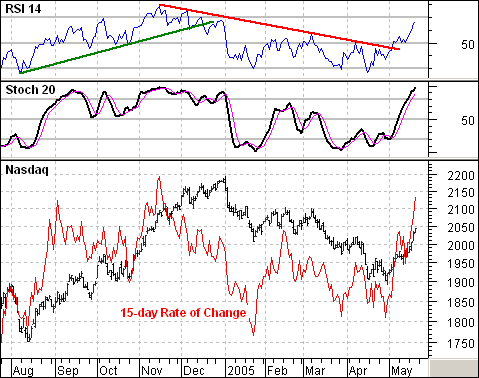
The current rally is the strongest of the year and is unlikely to disappear over night. This strength is confirmed by price movement as well as two momentum indicators. First, the 15-day Rate-of-Change surged to levels not seen since early September and mid November. Second, 15-day RSI moved to its highest level of the year. Third, the Stochastic Oscillator moved to its highest level since mid November. All three are testament to the power behind the recent move.
Even though the Stochastic Oscillator has become overbought, the 2004 rally suggests further upside before all is said and done. Notice how the Stochastic Oscillator became overbought in September, October, November and December (four separate times). The Nasdaq became overbought and pretty much remained overbought as it kept rising. Moreover, the Stochastic Oscillator remained above 50 the entire time. As long as this indicator remains above 50, I would consider the trend firmly bullish and expect higher prices.
RSI also shows further room for gains. This indicator becomes overbought when it crosses above 70. It lagged the Stochastic Oscillator in 2004 and did not become overbought until November. Notice how RSI held the green trendline the entire rally and the red trendline the entire decline. I would look for a new trendline to emerge in the next few weeks and this will define the current uptrend.
One of Decision Point's proprietary indicators is the Participation Index (PI). It measures extreme (climactic) activity within a short-term price envelope. When a large number of stocks are participating in a particular price move (up or down), we recognize that such high levels of participation are unsustainable and refer to it as a "climax".
There are two kinds of climaxes -- an initiation climax, which marks the beginning of a longer-term price move and an exhaustion climax, which marks the end of a price move. Both kinds of climax can be followed by some consolidation activity before the trend changes or continues.
On the chart I have marked three upside climaxes. With 20-20 hindsight we can easily conclude that the first two are exhaustion climaxes, but I have designated the last one, the highest PI reading in a year, as an initiation climax, although the jury is not in on that one yet. My reasons are that price has broken out above the declining tops line that has been in effect since January, and during May UP Participation has expanded significantly while DOWN Participation has contracted sharply.
While my annotations point out upside climaxes, there is a classic downside initiation climax on the second trading day of January. It is followed by two weeks of consolidation, then the down leg is completed with an exhaustion climax on January 24. The final selling climax for the four-month down trend doesn't occur until April 17.
Climactic indicator readings identify points at which the market is overbought or oversold, but they don't always mean that the trend is about to change directions. Currently, the market needs to correct its overbought condition, but it does not appear to be vulnerable to a reversal of trend.
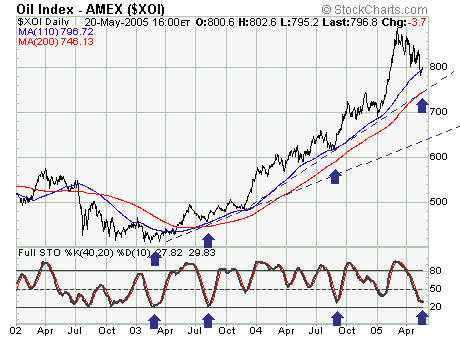
Quite simply, the recent decline in the AMEX Oil Index (XOI) appears corrective in nature; and thus one would want to be long these shares at this time as the risk-reward parameters are now favorable.
If past is prelude, and although it is not perfecta simple rhyme will do; the current correction is testing the sharply rising 110-day moving average, which when coupled with the lower 40-day stochastic level has provided excellent buying points over the past several years. If this test is successful as we expect; then a test of the highs is forthcoming. Therefore, we are long shares such as Exxon (XOM) and Chevron (CVX); but looking to add more and add oil service shares as well.