Our Spring Special is running throughout the month of May! Let me repeat that in case you missed it: Our Spring Special is on from now until May 31st! Sorry for the blatant plug, but every time one of these special periods end, we get flooded with message from people who claim that they missed it. The reasons range from the comic to the tragic and we do our best to accommodate everyone but it is waaaaay better if everyone would sign up for the special NOW while it is on, instead of sending us panicky email after it ends.
I will now take questions from the audience:
Q: What the heck is the "Spring Special"? A: From now until the end of May, if you sign up for 12 months of any of our charting services, you will get 2 additional months for free. If you sign up for 6 months of any service, you will get 1 additional month for free. It's that simple. Click here to get started.
Q: I'm already a member. How can I take advantage of this special? A: No problemo. The same deal applies to anyone who extends their existing membership. Extend for 12 months and you'll get 2 free months. Extend for 6 months and you'll get 1 free month.
Q: My membership doesn't expire for a long time. Can I take advantage? A: Sure, if you want. You can "lock in" even more time at these special rates right now. We'll just push out your expiration date.
Q: Does the special apply to service upgrades? A: Nope - however, you can upgrade your service and then use the special rates to extend your new service for 7 or 14 months. BTW, always upgrade BEFORE extending your account! It will save you a significant amount of money.
Q: OMG! I just extended my account two days ago and now you guys are running a special! I can't believe I missed it! A: You probably didn't miss it. We started running the special several days ago. Check your email confirmation to see if you got the special rate. If you missed the special, you can always extend your account again right now to "lock in" more time at the special rates.
Q: I use StockCharts.com all the time. Can I get more than 14 months of service at this special rate? A: Sure. Just place two or more orders and we'll extend your account by the appropriate amount.
Q: Do I need a coupon code to qualify for the Spring Special? A: Nope.
Q: How frequently do you run specials? A: That depends on a variety of business factors. We make no guarantees about when or how often we will run specials. My advice is to take advantage of them when the appear because they might not be back for some time.
Q: Any price changes on the horizon? A: Not at this time however keep in mind that StockCharts.com has never changed its prices. That goes all the way back to January 2002 when we first introduced our full line of subscription services. How many other things do you know of that are the same price now that they were back then?
Q: Got any other specials for us? A: Glad you asked! As a special reward to everyone that has read this far in the newsletter, I have a secret coupon code that you can use in our on-line bookstore for a 25% discount on anything we sell there! Just use the coupon CWMay2007 when completing your bookstore order. This is the biggest discount we've ever offered for our bookstore. Don't let it pass you by - it also expires at the end of the month.
One of the most consistent of all intermarket relationship is the inverse relationship between gold assets and the U.S. Dollar. Nowhere is that more evident than in the chart below. The green line plots the U.S. Dollar Index (which measures the dollar against six foreign currencies. The Euro has the biggest impact in the USD). The orange line is the Gold & Silver (XAU) Index of precious metal stocks. It's clear that they trend in opposite directions. For example, the 1996-2000 dollar rally coincided with a major downturn in the XAU (see arrows). The fall in the dollar at the start of 2001 helped launch a major upturn in gold shares. The most important feature of the chart is that both markets are at key junctures. The green line shows the Dollar Index testing its all-time low along the 80 level. The orange line shows the XAU testing its all-time highs around 150 reached in 1987 and 1996. The fact that the XAU is stalled at long-term resistance may also explain why precious metal stocks have lagged behind the commodity over the last year. That may also explain why the bull market in bullion has been stalled since last spring.

Even though the Dow is trading at all time highs and the S&P 500 is trading above 1500 for the first time since 2000, the Russell 2000 continues having trouble with resistance around 830. Thinking in terms of Dow Theory, I view this as a non-confirmation. A bull signal is triggered or renewed when both the Dow Industrials AND the Dow Transports move to new highs. Failure by one of these averages results in a non-confirmation and this questions underlying strength.
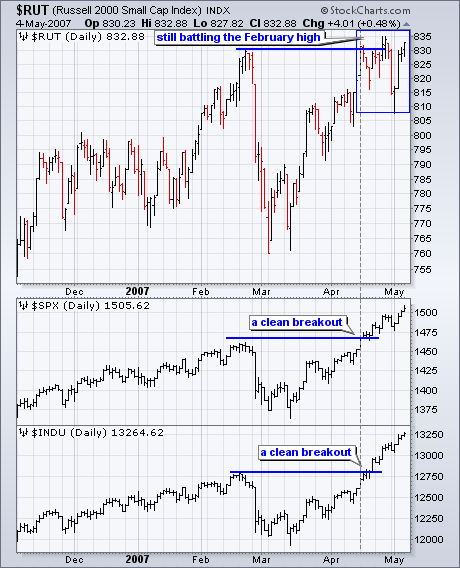
The Dow and the S&P 500 cleared resistance with relative ease, but the Russell 2000 has been consolidating around 830 the last three weeks. Technically, the Russell 2000 closed above its February high in late April and again in early May. Realistically, the index has yet to forge a convincing breakout and relative weakness in small-caps is casting a shadow on the current rally. The Russell 2000 represents, uh, 2000 stocks and it would be nice to have them on board to confirm strength in large-caps.
The weekly chart of the S&P 500 Index below reveal that prices are behaving in a very bullish fashion. The index has broken above the gradually rising trend channel that prevailed from 2004. In March prices pulled back and successfully tested the support provided by the top of the channel. Since then the rally resumed, making new highs and apparently establishing an even steeper rising trend channel.
Because prices have reached the top of the channel, we must consider that the market is overbought, and there are plenty of other indicators that will confirm this; however, there is no technical justification to turn bearish at this time. It is possible for prices to continue to rise just below the top of the channel, or another correction may take place, taking prices back to the bottom of the channel. Worse could happen, but I do not expect it.
Bottom Line: Overbought conditions in bull markets may cause more caution than usual, but higher prices can occur, even as the overbought condition corrects.
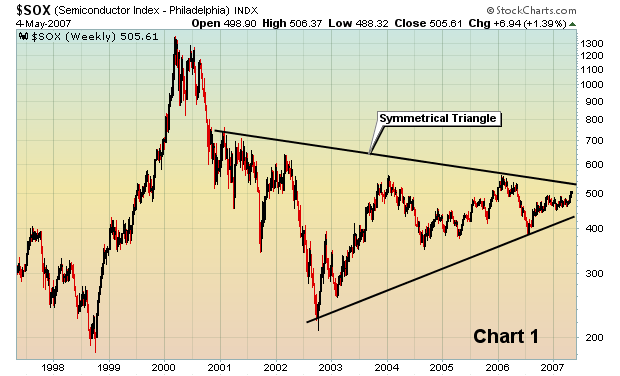
We've been watching and following the semiconductors for the past many months, awaiting their attempt to join the stock market's rally. But it hadn't happened....until this past week. We have remained steadfastly bullish over the past couple years and became very bullish when we saw long-term positive divergences form on the MACD on the major indices last July. Lower lows were in place, but the MACD actually put in a higher reading on those lower lows. We could see that selling momentum was dying. In articles over the past several months, we've indicated that we believe the market could be ripe for an advance - the likes we haven't seen seen since 1999 and early 2000. However, we also indicated that we expected the Semiconductors to participate. We felt we needed to see participation from the semiconductors in order for the NASDAQ to lead the major indices higher. Let's take a look at two charts. First, let's look at the Semiconductor Index (SOX). We've seen repeated struggles at 492 until finally we got the breakout we were looking for. Not only did we see the breakout, but we've since retested that breakout area and by the end of last week were looking to breakout again. This is bullish action by the group and we're not looking for any significant resistance until the 530-540 area. If the semiconductors can take out that symmetrical triangle downtrend line shown below, there is solid potential for a very significant rally in this group.