Hello Fellow ChartWatchers!
The markets all moved higher this week with the Dow setting a new all-time high on Friday and the Nasdaq moving to within spitting distance of 5000. Since the start of 2015, the Nasdaq has been on a tear, gaining over 4.6%. Here's a link to our Major Averages PerfChart that shows YTD performance so far. For more on the markets, skip on down to John Murphy's and Arthur Hill's commentary. I'm going to spend the rest of this article talking about how to get the most out of all the market commentary we put out each week.
Too Much Information Running Through My Brain
Things were much simpler back in 1999. We just had one thing - the ChartWatchers newsletter - this newsletter! Now-a-days things are a tad more complex. DId you know that we post, on average, 16 blog articles a week? We also pump out 4 hours of webinar time each week. And both of those numbers are guaranteed to increase later this year (and next year, and the year after that...) There's sooooooooo much content to keep up with. What's a "Fellow ChartWatchers" to do!?
The key to getting to most out of all this information is to prioritize the content that you enjoy ahead of content that doesn't do it for you. To help with that, let me review all of our current blogs and webinars and give you some advice on what to read if your time is limited.
Disclaimer: We - StockCharts.com - are not financial advisors. We do not make specific buy/sell recommendations or stock picks. We don't have a track record. If you think we are recommending that you buy or sell something, re-read what we said. We don't do that. Instead, we try to help you understand the higher-level forces in the market and how your can use charts to make better investing decisions. That is always our goal.
OK - with that out of the way - where should we start? For the purposes of this article, I'm going to assume that your time for reading market commentary is limited. (If you have tons of time, great! Just read everything.) Given that, how should you prioritize your reading? Here's a list that should help. Start at the top and read as many things as you want. Stop whenever you run out of time/interest.
1.) ChartWatchers! Hmmm... It looks like you are already doing that right now. Excellent! As a reminder, ChartWatchers is our free, twice-monthly newsletter that we've been emailing out since 1999. It contains articles from John Murphy, Arthur Hill, Greg Schnell, me, Carl & Erin Swenlin and much more. It also helps you keep up with the latest improvements to the website. You can use the form at the bottom of our homepage to subscribe (but I bet you already did!).
2.) Read John Murphy's Market Message - The Market Message is our premiere market commentary area. John Murphy is the master of technical market analysis. If the question is "Chip, I only have time to read one of the blogs on your site, which should it be?" the answer is easy. "Read the Market Message." (For examples of John and Arthur's work, see below.) To read the Market Message on a daily basis, you need to be a member of StockCharts.com. Any membership level works. Just log in and click on the "Market Message" tab at the top of any page. The latest articles will be listed at the top of the page. Below that are areas for Arthur Hill's optional (but very cool) Market Message videos as well as his recent "Art's Charts" articles. Art's Charts is a side-blog that Arthur Hill updates every morning before the market opens with shorter-term analysis and ideas. Definitely worth a read if you have time in the morning.
3.) Review Martin Pring's Market Round-Up - Martin Pring and Greg Schnell provide an international, multi-market view of things twice a week that is also extremely valuable. If you want to know how the US is doing relative to other countries, or you want to understand what is currently going on in the important commodity markets, this is the blog for you. Like the Market Message, this blog is available to all StockCharts members regardless of service level. To see the latest article, click on the "Blogs" tab at the top of any page and then look for a green article summary with Martin's picture in it. Here's a direct link to the Market Round-Up blog.
4.) Read the DecisionPoint blog - this free blog contains Erin & Carl's latest timing observations and thoughts about where the US markets are headed. This is the free DecisionPoint blog that you can find on the "Blogs" page. We also have two members-only DP blogs that contain detailed reports and data tables that back up Erin & Carl's analysis, but those can be a little overwhelming at first which is why I recommend starting out by just reading the free "DecisionPoint" blog instead.
5.) Into Self-Improvement? Read Gatis Roze's and/or Greg Morris' blogs - Both of these blogs are full of sage advice from experienced financial pros. Both blogs challenge "conventional" wisdom and will make you think. Often, they contain articles about the non-sexy - but VERY important - aspects of trading and investing that everyone ignores. Gatis' blog is called "The Traders Journal" and Greg's is called "Dancing with the Trend." Both blogs contain "timeless" articles that will be just as valid in 1 year (or 10 years) as they are today.
6.) Love Technicals? Greg Schnell's blog is for you - Don't let the name of free Greg's blog - "The Canadian Technician" - fool you. Greg's a prolific writer and covers most markets, not just Canada. As just one example, recently Greg wrote a great 6-part series on Market Manias.
7.) Bored? Take 30 seconds and review "Don't Ignore This Chart" - this free blog is updated every day with one chart and one paragraph. A "quickie" chart that might make you pause and think and maybe even learning something.
8.) "..and the rest!" - there are 5 other great free blogs on our site including "RRG Charts," "Scanning Technically," "Step-by-Step," "Top Advisors Corner" and my own un-biased personal favorite, the "Chip Anderson" blog. Don't get me wrong, these are all awesome and worth reading - but if you are short on time, you can save them for later if you want.
Again, you'll find links to all our commentary articles on the "Blogs" page. Most of it is free for every to read. Members can also visit the "Market Message" page to see John and Arthur's work.
One last thing - If you find yourself reading a particular blog often and you enjoy its content, be sure the "Subscribe" to the blog by clicking on the "Email updates" link on the right side of the blog's pages. As a subscriber, you'll get email notifications whenever a new article is added to the blog. Subscribing is also the #1 way you can show your support for an author's efforts. They LOVE their subscribers!
I sincerely hope this overview helps you get even more value from StockCharts!
- Chip
P.S. I did a presentation about this same material on Saturday's "ChartWatchers LIVE" webinar. Gatis Roze also stopped by during that talk. You can watch the video recording by clicking here.
- DIVIDEND INDICATOR - We've just added another indicator to SharpCharts - the "Dividends" indicator - that shows you recent dividend amounts for most US and Canadian stocks. Since dividends are usually declared on a quarterly or yearly basis, this indicator is best used with a long-term chart. Monthly bars generally work well. Here's an example
 (click the chart for a live version)
This chart also demostrates our "Events" overlay (the data boxes at the bottom of the price area) and our new Annual Dividend and Yield data in the Full Quote window at the top of the chart.
- NUMBER OF LSE STOCKS DOUBLE - We've added LSE AIM stocks to our database, doubling the number of LSE issues in our database.
- WEBINAR VIEWERSHIP CONTINUES TO GROW - Don't miss out on our various webinars each week. They are proving very popular with everyone who attends. Arthur Hill's "Market Message LIVE" happens each Tuesday at 1pm Eastern and Erin Heim's "DecisionPoint LIVE" goes each Wednesday at 4:30pm Eastern. For more details, check the "What's New" area on our homepage.
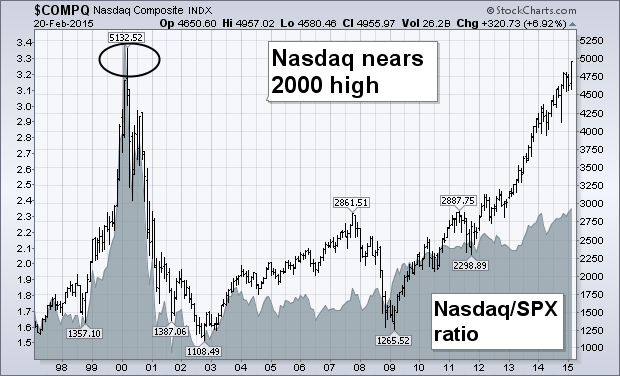
The monthly bars in the chart below shows the Nasdaq Composite ending the week just 177 points (3.5%) from its March 2000 intra-day high at 5132. [It's only 93 points (1.9%) from its 2000 closing high at 5048]. There's little doubt that it will reach that major milestone in short order. The question is what will happen when it gets there. It's not unusual for a major index to encounter some profit-taking when it reaches a major previous peak. But I doubt it will mark a major top. Although it's currently the only U.S. stock index that hasn't hit a record, that doesn't mean that it hasn't done as well as the others. It's actually done much better. It just had more ground to make up. The Nasdaq lost nearly -80% between 2000 and late 2002, while the S&P 500 and Dow lost -40% and -20% respectively. Since the 2002 bottom, the Nasdaq has gained 320% versus an S&P 500 gain of 160% (the Dow rose 140%). Since the spring 2009 bottom, the Nasdaq gained 260% which outpaced an S&P gain of 187% (and the Dow's 156%). That stronger Nasdaq performance can be seen by the rising Nasdaq/SPX ratio (gray area) since the 2002 and 2009 bottoms. The fact that the technology-dominated Nasdaq is leading the market higher argues for continuation of the secular bull market. So does stronger action in foreign markets.
- John
Chartists looking to filter small price movements and add a systematic touch to their analysis can turn to Point & Figure charts. Chart 1 shows a 60-minute P&F chart for the **S&P 500** and each box is five points. With a traditional 3-box reversal setting, this means a move greater than 15 points is needed to reverse a column. Note that the X-Columns represent rising prices and the O-Columns represent falling prices. Even though this P&F chart is based on intraday prices (60 minute), it **extends back to mid October and captures the medium-term trend quite well**. Before looking at the analysis, note that the red lines are bearish resistance lines drawn down at 45-degree angles. When prices break above a bearish resistance line, a blue bullish support line is drawn up at a 45-degree angle. This means prices are always above or below one of these lines.
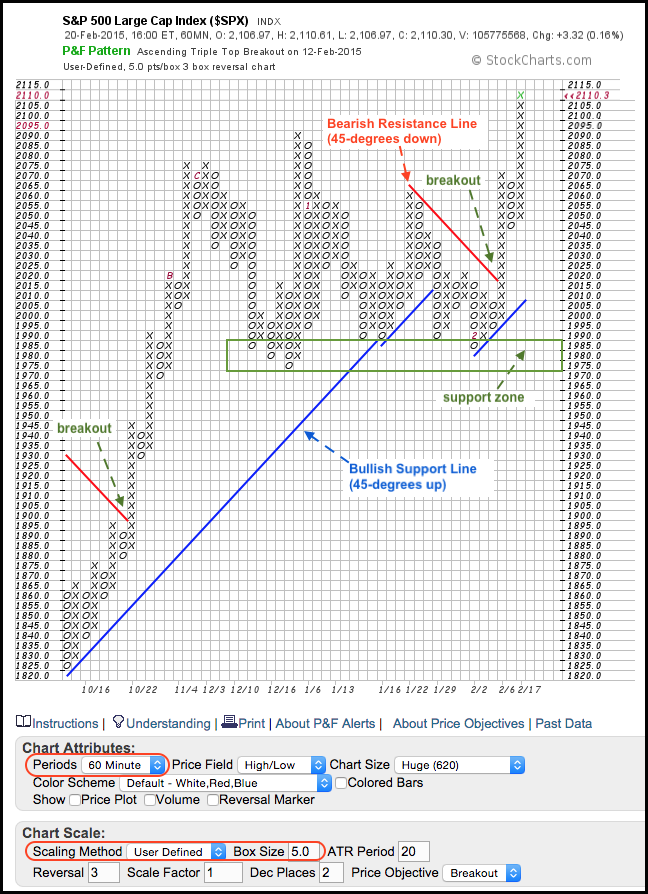
The trend line signals provide a systematic element to chart analysis. A break above the bearish resistance line is bullish, while a break below the bullish support line is bearish. We have seen three signals since mid October and the current signal is bullish. Notice how the index broke above the bearish resistance line with the surge above 2025 in early February. A new bullish support line was then drawn from the low of the move and it extends up at a 45-degree angle. These systematic signals can also be used to establish a trading bias for a shorter timeframe. And finally, note that P&F charts are excellent for marking support and resistance zones. The lows extending back to December mark a support zone in the 1975-1990 area. A break below this zone would call for a reassessment of the long-term uptrend.
There is a relatively new song "Its all about the base" that jingles in my head every time I see these big broad trading ranges set up. Ebay is destined to be a classic technical analysis story when it breaks out from this consolidation. FireEye (FEYE) just broke out of one for a recent example.
On September 30th, 2014 Ebay Inc. (EBAY) announced that they were going to split out Paypal into a separate company under a new IPO. I couldn't find a date for the IPO, but the stock has been waiting for something. The only thing that paces back and forth more is a momma bear looking for her cubs. In a world of buy and sell, Ebay's stock couldn't be more trying. Indicative of an auctioneer running up the price only to slam the gavel and announce sold, this stock is clearly in that rhythm. As a short term trader, you need to trade this on the location of the stock price relative to the channel. Buy on the lows, sell near the highs. Buy on the lows, sell near the highs. Buy on the lows, sell near the highs.
What makes Ebay worth talking about now? The Paypal IPO. While the stock has gone relatively quiet in terms of volume, the price action recently couldn't be cleaner. The 'zoom' panel shows exactly that, straight up for 15 days in a row. So is this imminent? I think once the announcement of the date is set, it will probably be more difficult to find an attractive entry for the stock. This might be one of those stocks that needs a well thought out plan to be profitable because the entry will be key to profit. If you buy it near the highs, you risk the entire size of the channel. If you buy it near the lows, the stock is giving off nice clues that there is plenty of support. However,January 2015 was the first time in the entire trading range that EBAY bounced off the 200 DMA. The SCTR rankings have recently tested the 75 level twice which is usually a good clue that investor sentiment is changing in the stock. We can see almost two years of a weak SCTR only to finally get some upside enthusiasm after the announcement of the proposed IPO. The purple relative strength trend lines show EBAY under performing the $SPX for almost two years. It has not started to outperform, but at least the under performance is changing. The horizontal line in purple makes this stock interesting right here.
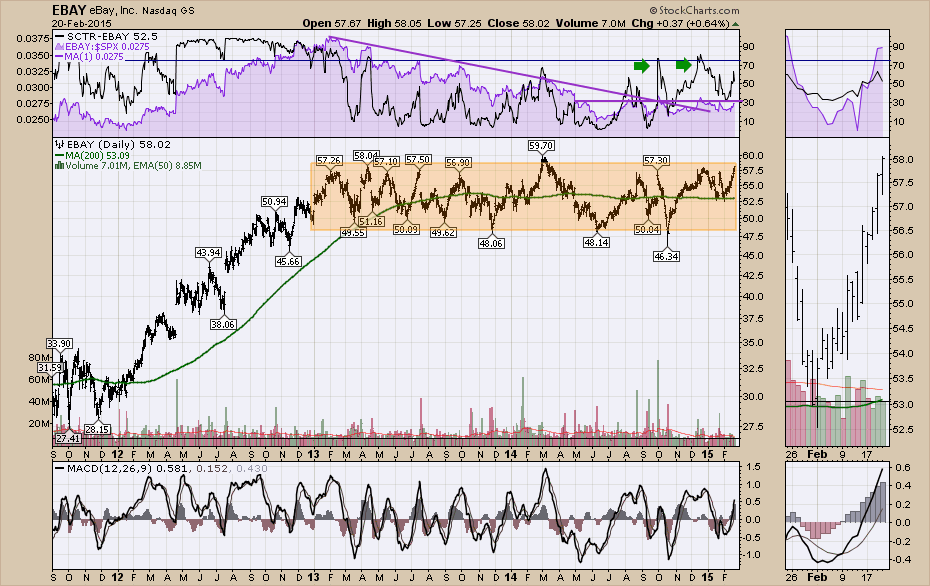
The final two indicators, volume and MACD are two different stories. The volume has dried up on a daily basis making it very interesting. Are we running out of sellers or buyers? Doesn't look like buyers are the problem as they have bid the price up for 15 days in a row. It might be a lack of sellers. The MACD is not very helpful here other than to say you are too late to trade the channel trading range.
The last indicator is price. EBAY made new 10 month highs on Friday. The highs in August and September were also bullish. I think the better clue here is the support at the 200 DMA. This looks like a stock that breakout buyers are starting to get interested in and the channel is about to be broken. I obviously don't know when the IPO date will be announced but the change in the stock is notable here. The 10 month new high on quiet volume shown by the black line makes a good mystery. Ralph Vince suggests being very observant on really high volume or really low volume. Both can be important clues. We can see the average volume has dropped substantially since the September 30th announcement. This suggests to me accumulation over time. When the volatility and the volume drop in the stock, its usually the calm the before storm. EBAY should be an auction to watch over the coming months.
Good trading,
Greg Schnell, CMT
On Friday's DecisionPoint Alert Report, the Utilities SPDR (XLU) went on a Neutral signal. It's sister, the equal-weight Rydex version (RYU) remains on a BUY signal. It appears that it will flip next week to a Neutral signal as well.
We see that Intermediate-Term Trend Model generated the Neutral signal on XLU when the 20-EMA crossed below the 50-EMA. It didn't generate a SELL signal because the 50-EMA is above the 200-EMA. When the 50-EMA is above the 200-EMA we consider XLU to be in a "bull market". Price has been flirting with rising bottoms support drawn from the August 2014 low but hasn't broken down. However, on the bright side (yes there is a bit of bright side here), the Price Momentum Oscillator (PMO) is nearing what appears to be oversold territory and possibly slowing its descent.
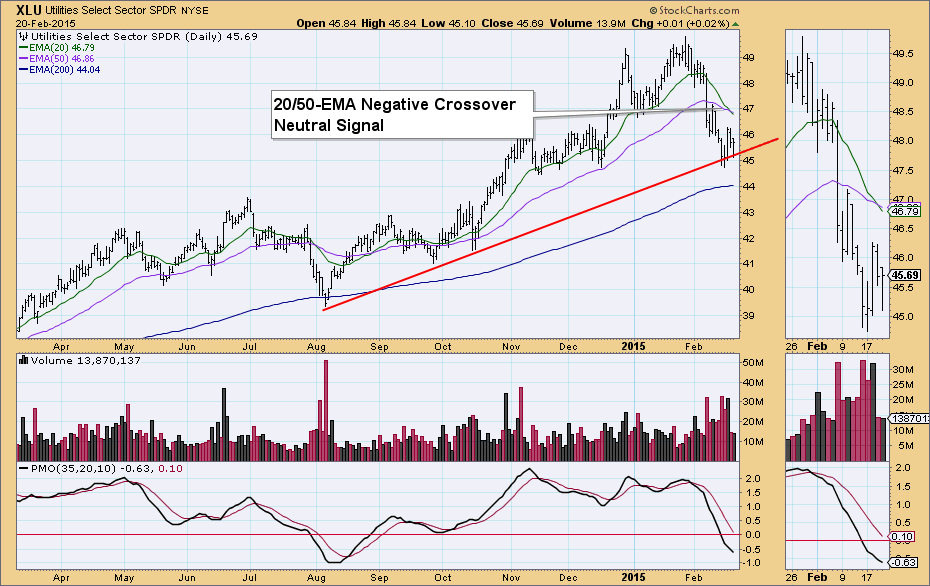
One way to determine if the PMO is reaching ordinary overbought or oversold territory, you can move the dates out on the daily chart and see where it tends to oscillate. I've increased this daily chart to a five-year versus a single year. In XLU's case the PMO range is 2 to -2. So technically a -.63 is not that oversold. Yet, when we look at where the most recent bottoms are it is more like a -1. So indeed, the PMO is oversold on XLU and could be ripening for a bottom signifying a switch in momentum. Of course it also means that it could accommodate much more downside before hitting extremely oversold territory.
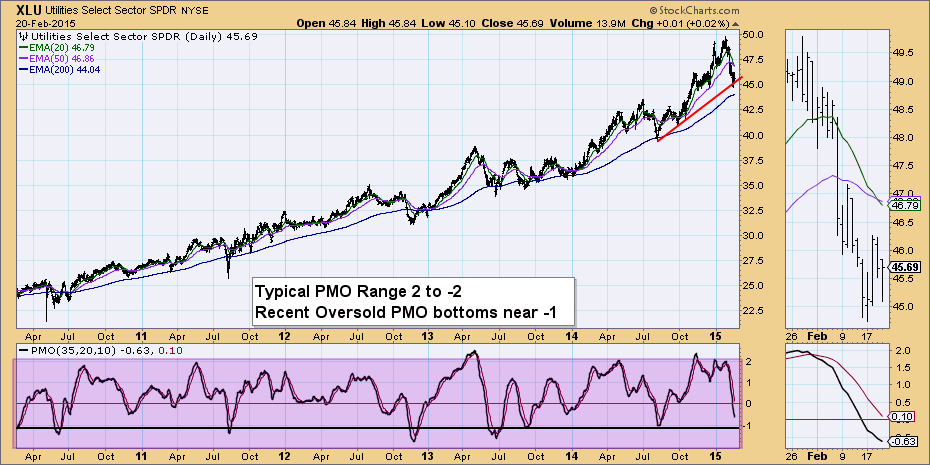
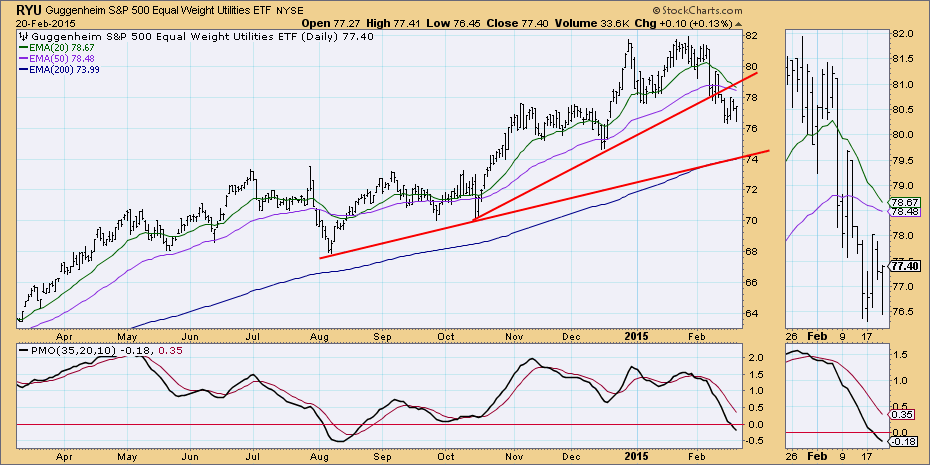
Let's take a look at the equal-weight Utilities ETF (RYU). The chart is very similar, as we would expect. It will generate a Neutral signal soon when the 20-EMA crosses below the 50-EMA. I also note that price has not hit rising bottoms support like XLU and it has quite a distance to cover before it does. I believe that doesn't bode well for XLU.
The Utilities sector is the first to flip back from BUY signals on the DP Alert Daily Report. If we start seeing more turnover on that table it is a warning flag regarding the weakness of the market as a whole.
Don't forget to sign up to attend my next DecisionPoint LIVE! webinar next Wednesday, February 25th. Here is a link to the sign up page. Be sure to tweet your chart requests @_DecisionPoint for guaranteed review or bring them and it might be chosen for review at the end of the program.
Happy Charting!
Erin
We've seen a very nice rally in U.S. equities during February, erasing all of January's losses with most of our major indices now breaking out to all-time highs. The NASDAQ has been leading the charge and that indicates that we're in a "risk on" environment, which is bullish for equities. Confirming that bullish environment is the relative performance of consumer discretionary stocks (XLY) vs. consumer staples stocks (XLP). In my last article, I provided a chart of the XLY showing the breakout that occurred in early February. Home construction ($DJUSHB) was a leader during that breakout and the rally in discretionary stocks has continued the past two weeks. More importantly, the ratio of the XLY:XLP has been on the rise. This tells us that traders are much more interested in the discretionary side (aggressive side) of consumer stocks. That could change in the near-term, but before I explain further, take a longer-term look at how this ratio has performed:
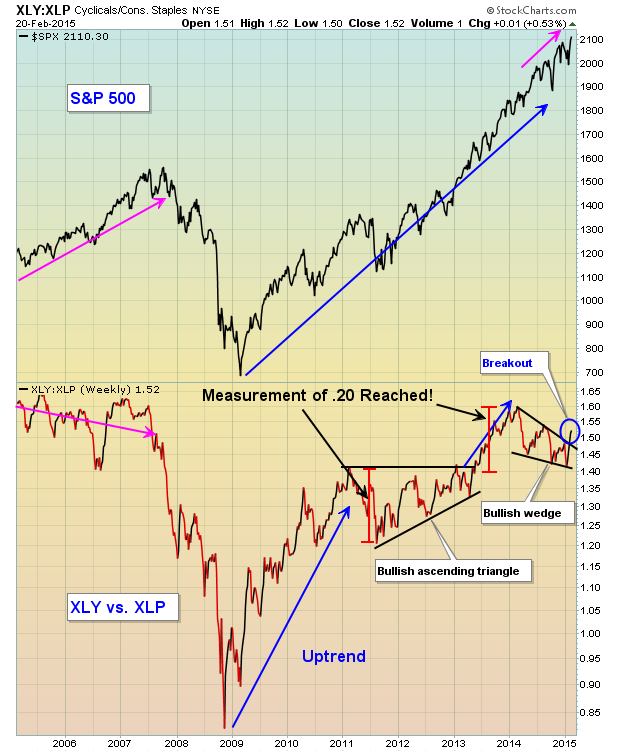
Over the last year, the XLY:XLP ratio has been trending lower, which generally I'd consider to be a bearish development. But relative charts can consolidate in continuation patterns just as individual stocks and indices do. You can see the ascending triangle that printed during 2011 and 2012, just prior to consumer discretionary stocks exploding higher in 2013. The past year appears to have set up a bullish wedge, the breakout of which is likely to lead to a strong discretionary sector throughout 2015 - at least based on current technical signs.
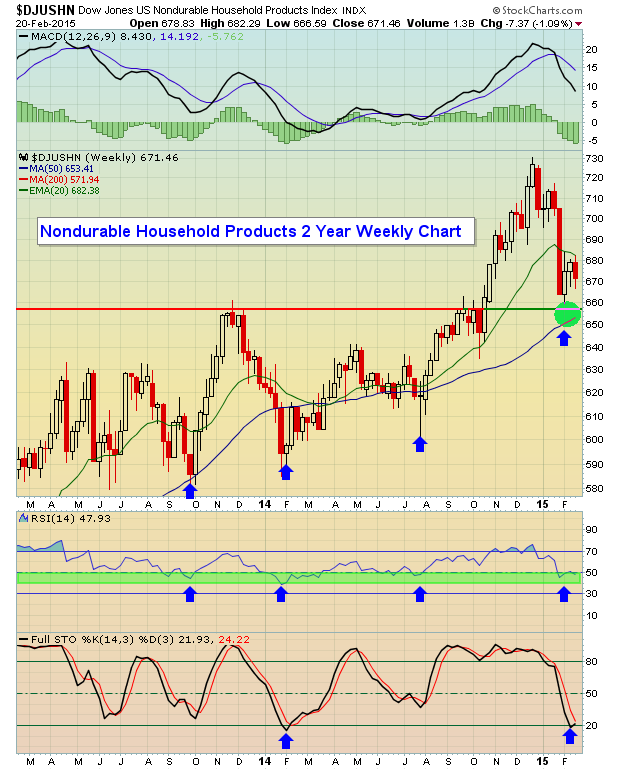
The recent selling has taken place within the confines of an uptrend. Note that each time the DJUSHN has bottomed on its weekly chart over the past couple years, we've seen an RSI in the 40s. On Friday, the weekly RSI was just beneath 48. The green circle highlights an area that I'd watch closely. Price support can be seen in the 650s while the rising 50 week SMA is at 653.
One stock in this industry group has been under tremendous selling pressure lately but is testing major price and gap support. I'm featuring this stock as my Chart of the Day for Monday, February 23rd. If you'd like to check it out, simply CLICK HERE (http://www.investedcentral.com/public/chart-of-the-day.cfm) to register - it's FREE!
Happy trading!
Tom Bowley
Chief Market Strategist
Invested Central


 For over fifty years, Harvey Baraban has been an active stock market investor. For over twenty-five years, he has been my mentor, friend and trading buddy. Drawn together by a mutual shared passion for the markets, I am grateful to Harvey on many fronts, not the least being that he was the one who encouraged me to start teaching the investment classes that I've now done at Bellevue...