CHARTCON 2016 PREVIEW
by Chip Anderson | ChartWatchers
Hello Fellow ChartWatchers!
The markets continue to move sideways causing trend and momentum indicators to gradually lose their usefulness. The best way to see that is to look at the "2000 DJIA - Daily Analysis" chart on the new "ChartWatchers LIVE ChartList" (click on the link and then scroll down). This is a list of charts that I track for the ChartWatchers Live webinar (which happens every other weekend). I haven't updated the annotations on those charts since my last webinar back on August 13th and, frankly, I haven't needed to. Sideways consolidation periods can be frustrating, but they usually resolve themselves in the same direction as the original trend - upwards in this case. Time will tell.
ChartCon 2016 Preview
 As you hopefully know by now, ChartCon 2016 is right around the corner (Sept. 23rd & 24th) and things are really busy here as we prepare for our biggest conference ever. At this point we have over 800 people registered for the conference. That's almost triple the number that attended our previous conference! And registrations are still coming in - we hope to have over 1000 attendees registered by the time things get started on Friday, September 23rd.
Behind the Scenes
I want to take a moment and give you a quick behind-the-scenes look at all of the preparations that are underway right now so that you will have a better sense of what ChartCon 2016 will be like. What should attendees expect to see from our first ever on-line conference?
First off, ChartCon will be broadcast via the Livestream video platform, so ChartCon viewers will use a web browser (or app) connected to the special Livestream video page to see the conference. You can test out the Livestream platform right now to make sure that it works well for you - just click here and select any of the free streams that are currently going on (Ironman World Championship anyone?). Livestream works really hard to optimize the stream to work with whatever bandwidth you have and so hopefully you will see a good, quality video when you run this test. If you have any problems, click here for help.
Now, in addition to the video broadcast, ChartCon 2016 will also feature a mobile app created by a service called GuideBook. The ChartCon Mobile app can be installed on any smartphone or tablet - we will be sending out the link later next week. Once complete, you'll be able to use the ChartCon Mobile app to see the conference schedule, submit questions, chat with presenters, chat with other attendees, see social media posts, and much more. We think that the ChartCon Mobile app will really help ChartCon attendees get the most out of the conference.
Finally, we have assembled a top-notch crew of video engineers, designers and technicians who are all working very hard to make the ChartCon broadcast as smooth, useful and informative as possible. ChartCon 2016 will be very different from the one-persion webinars we have been doing up until now. We're talking sets, lighting, audio designers, pre-recorded videos, you name it! I am seriously considering having a credits scroll at the end - that's how many people are involved in helping make this ChartCon great.
"Sounds good Chip, but what about the presentations. What will I learn from them?"
Great point! All of this behind-the-scenes stuff is pointless unless we have great presentations to show, right? So first off, let me describe the general format of each talk and then I'll go over more details about what the conference will look like.
The General Presentation Format
In general, each presentation will last about 60 minutes. During each presenter's talk, you will see them on the main stage as they lead you through their slides and charts. At some point, they will probably switch over to the web and do some live demonstrations as well. While the presenter is presenting, you will be able to send in your questions via the mobile app on your smartphone or via social media (Twitter or Facebook).
After the presention is complete, there will be a 5-minute break as we move over to the "Interview" stage where the presenter will then answer the questions that were sent in during their talk. That Q&A segment should last about 20 minutes and then we will be ready for the next presenter.
After they are done presenting, presenters may hang out for a bit online (via the app and social media) to answer even more questions depending on time.
Between presentations, we'll have short breaks so you can get up and stretch, etc. In addition, attendees have the option of pausing the Livestream broadcast at any time on their computer just like it was a DVR recording. During the short breaks, we will be showing pre-recorded videos with lots of tips and tricks on how to get the most out of the tools on our website.
Click here to see the official Conference Agenda
A Quick Overview of the Presentations
So the theme of the conference is "Creating Your Own Technical Trading System" and we will spend much of the first day showing off several different ways that anyone can use StockCharts.com to make better trading decisions based on charts and visual analysis.
The conference will kick off with myself and Grayson Roze helping everyone get up-to-speed with Livestream and the ChartCon Mobile App. After those formalities, I'll talk about what a "Technical Trading System" is, what goes into make one and how you can tell if your system is working well for you. I'll present my own relatively straightforward system as an example and explain how and why I think it works.
After my talk wraps up, Arthur Hill will present a much more thorough example of a technical trading system with automated rules and backtesting results. After Arthur, Greg Morris will change things up somewhat by going over common mistakes that make people make when trading using technicals.
Next up will be Erin Heim who will show us yet another technical trading system - her DecisionPoint system that is now built in to StockCharts.com. And after Erin, Gatis Roze will take the stage and talk to us about his compehensive technical trading system - Tensile Trading - and how he uses it successfully every day.
So, right off the bat, you will see at least 4 different, successful technical trading systems that use StockCharts tools to make buy and sell decisions. But, more than that, you'll also be able to evaluate each of those systems and determine what parts best fit into your own investing. Remember, our goal here is to empower you to make your own investing decisions based on your own, customized, investing strategy.
Wraping up the first day will be our first keynote presenter, Martin Pring, with a big announcement about his Special K indicator and how it can be used as part of any technical trading system. Martin will also be reviewing the current state of the markets from his unique multi-market perspective.
And that's only the first day! The second day includes talks about RRGs, SCTRs, Wyckoff and Seasonal Trends with another keynote presentation from Sir John Murphy who will talk about Intermarket Analysis and the current technical state of the markets. The conference wraps up with a panel discussion that will include lots of Q&A from the audience and a final "put-it-all-together" talk from Grayson and myself that will be focused on concrete "next-steps" that you can take to bring the lessons from the conference into your own trading routines.
If you have registered for the conference already, you should have gotten your first "ChartCon Insider" newsletter the other day. We'll be sending out more of those as the conference gets closer.
(If you haven't registered for ChartCon 2016 yet and want to join us for all the fun on Friday, September 23rd and Saturday, September 24th, simply click here to register for ChartCon 2016. We'd love to see you there!)
- Chip
P.S. One last thing - we still have 3 open VIP seats available if you'd like to attend ChartCon in person. If you will be in the Napa area later this month and would like to join us in person, please send me an email message and I'll get you all the details. This once-in-a-lifetime experience includes seats for the presentations, a reception dinner with the presenters and either 1.) a round of golf with Tom Bowley and Greg Schnell, or 2.) a hot air balloon ride over Napa with Erin and myself!
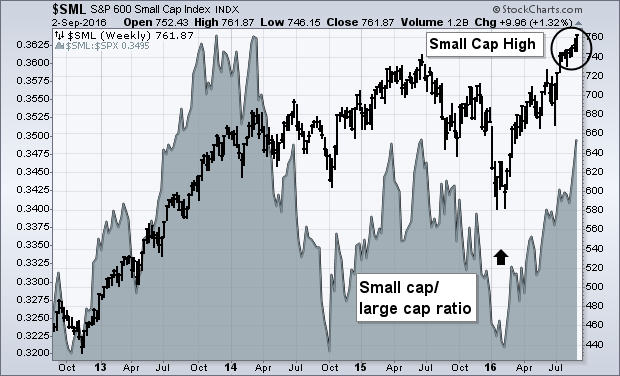
While most of the media focus is on sideways action in large cap stocks, smaller stocks have been rising. The weekly bars in Chart 1 show the S&P 600 Small Cap Index ($SML) ending the week at a new record high. The solid matter is a relative strength ratio of the SML divided by the S&P 500. It shows smaller stocks leading large caps higher since the February bottom. Smallcaps had been market laggards since the middle of 2014. Their relative strength ratio is close to a two-year high. That's a positive sign for them and rest of the market. Small cap leadership is a sign that investors are more optimistic on the economy and willing to assume more risk. The Russell 2000 Small Cap Index ($RUT) has yet to achieve a new high. I've pointed out in the past, however, that the SML has a history of leading the RUT higher.
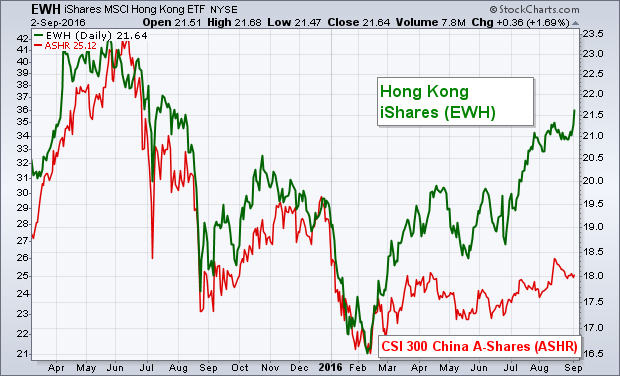
 Emerging markets ended the week on a strong note. I keep reading that Chinese stocks have not participated in the EM rally. That may be true in Shanghai, but not in Hong Kong. The green line in Chart 2 shows Hong Kong iShares (EWH) ending the week at the highest level in two years. I recently suggested that a more stable Hong Kong dollar was attracting money (versus mainland stocks that are denominated in Chinese yuan). A more international audience and better liquidity is another factor. So is the fact that Hong Kong stocks yield more than 3.5% which makes them attractive for yield-chasing investors. I believe it's just a matter of time before mainland Chinese stocks start rising as well. The red line plots the CSI 300 China A-Shares ETF (ASHR) which just recently hit an eight-month high. Rising Chinese shares would also be good for emerging markets in general.
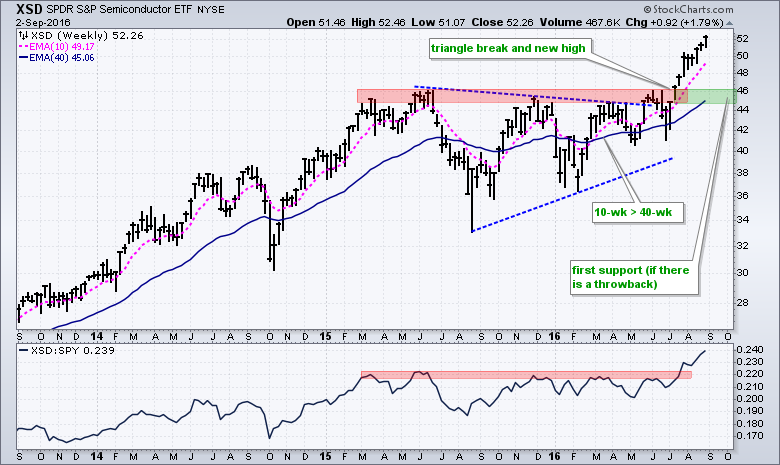
Semiconductors are leading the charge in tech stocks as the Semiconductor SPDR (XSD) extends its gains and notches another 52-week high this week. Note that the ETF is up around 15% the last three months and it is one of the top performing industry group ETFs. The Semiconductor iShares (SOXX) is also trading at a 52-week high. On the price chart, XSD broke out and the breakout zone in the 45-46 area turns first support to watch on a throw back. A throw back occurs when prices breakout and then return to broken resistance, which then becomes support. The indicator window confirms upside leadership as the price relative broke (XSD:SPY ratio) above its 2015 highs. Overall, it is positive to see this cyclical group leading the stock market.
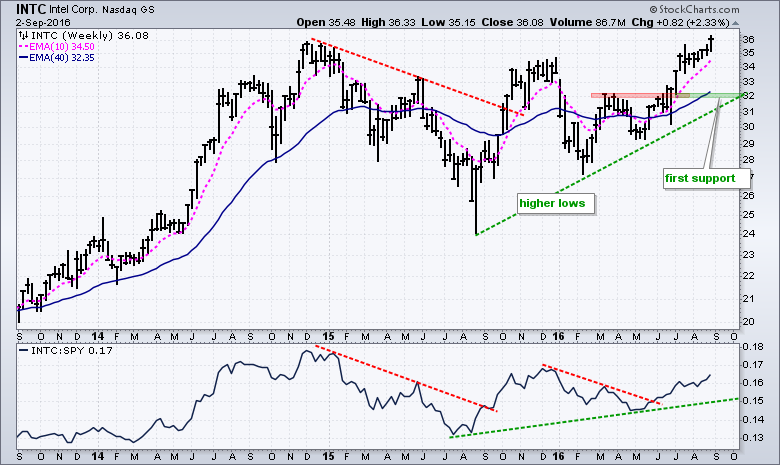
Intel surged over 2% this week and exceeded its 2014 high. The stock already hit a 52-week high in June and this week's high is a multi-year high. Any stock trading at a multi-year high should be considered a chart leader. In a separate, but perhaps related observation, note that Microsoft hit a 52-week high last week. This makes me wonder where DELL would be if it were still trading. Note that the newly formed Hewlett Packard Enterprise (HPE) is trading a new high.
 ****************************************
Thanks for tuning in and have a good weekend!
--Arthur Hill CMT
Plan your Trade and Trade your Plan
*****************************************
IT'S STILL A VERY BULLISH MARKET SETUP
by Greg Schnell | The Canadian Technician
I am not sure if everyone is watching how stellar the performance of the two particularly strong sectors in September has been.
A look at the one-month performance shows a clear lean on Financials and Energy. Everyone keeps pointing to oil's volatility but the energy stocks have some of the strongest SCTR's.

For a bull market, we want to see the stocks on the left side of this panel outperform. If we add a cycle line to the chart, it fits almost perfectly over the last month. This is a very nice bullish setup.
 The Bullish Percent Index (BPI's) are very strong. This is not an overbought condition. This is a very strong, broad, bullish setup. Usually, the Bullish Percents have to start making lower lows below 50 and then a lower high before the market struggles to make higher highs. Currently, the $BPNYA is still very strong. With the Percentage Of Stocks Above The 200 DMA ($NYA200R) in the lower panel showing a lot of strength, this is not the place where we usually collapse from.
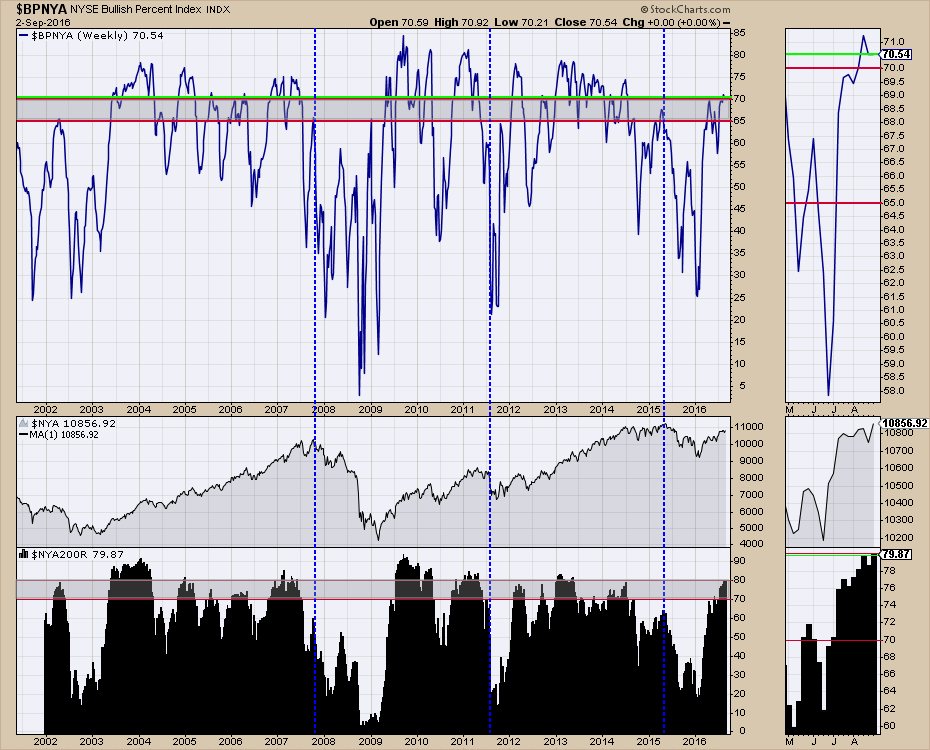 The energy stocks are dominating the SCTR lists and the Bank, Broker and Insurance stocks are moving into the top leadership area of the SCTR's. This looks like a nice setup for the 4th quarter at this point in time. That doesn't mean we won't get 3-5% pullbacks, but they should be bought as this looks like a strong setup for equities in the 4th Quarter.
This month, Chartcon 2016 is coming to you via live stream broadcast. Rather than have customers spend all the money to travel to the event, we have arranged for all the technicians to gather in one location and broadcast from there, saving you thousands of dollars. It should be a crazy couple of days with a tight synopsis of the markets from an award winning Technical Analyst crew. You can register for this event for under $200 and have access to the recordings. Chartcon 2016.
Next, I will be presenting in person at Golden Gate University in September if you are in the area.
September 20th, 2016 @ 4 PM
Golden Gate University. Rm 3214
536 Mission Street
San Francisco, 94104
Cost: Registration is $10 for MTA members and $20 for non-members
You can register through the TSAA-SF website. Click here.
Feel free to pass this article on to friends and family. If you would like to receive future articles by email, click on the Yes button below each blog. I do roughly one-two articles a week from each blog (Commodities Countdown, The Canadian Technician, Don't Ignore This Chart) so you need to subscribe to each one individually. I also do a couple of webinars each week and you can view those live or in our webinar archives. As a heads up, I'm on twitter @Schnellinvestor.
Thanks for taking the time to join me.
Good trading,
Greg Schnell, CMT, MFTA.
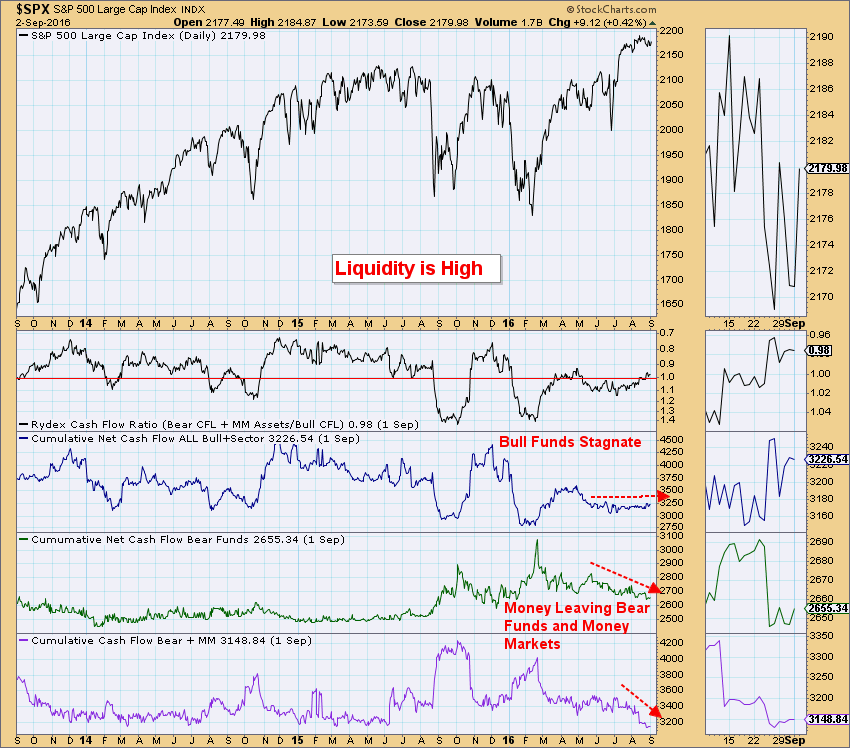
Liquidity can be equated to the availability of money. In terms of the market, when there is money on the sidelines, it is available for investing and could boost the market when/if it is invested. There are many measures, but I like using the Rydex Cashflow Ratio chart as a gauge.
Rydex has a set of mutual funds that work well for this. There are bear funds, money market assets and bull funds that are tracked and updated nightly. The cashflow chart shows us which direction the money is flowing and the ratio gives you the sentiment, low reading is bullish and high reading is bearish. This chart is fascinating! We can see that cash is flowing out of bear funds and money markets, but we aren't seeing an equivalent rise in the bull funds. This suggests there is money on the sidelines. It isn't a surprise. We are nearing the end of summer ("Sell in May, Go Away") but we have also been in a sideways trading channel on the SPX for some time. With overhead resistance holding tight and support holding up with no real discernible trend, it seems most investors would rather wait on the sidelines.
Note that the Rydex Cashflow Ratio is almost an even "1", which would be considered perfectly neutral. With money coming out of the bear funds, one would expect the amount of bull funds to increase and show a small ratio reading (when the denominator "bull funds" approaches infinity, the ratio gets smaller and smaller). Sentiment is not bearish, but it isn't bullish either.
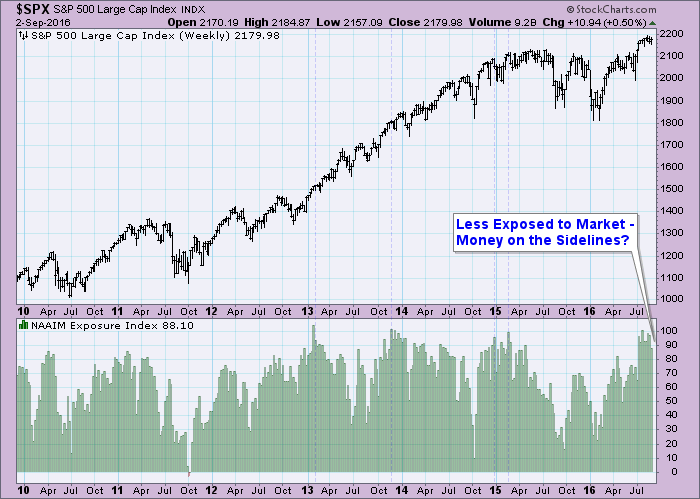
Notice that on the National Association of Active Investment Managers (NAAIM) sentiment chart, we can see that market exposure is being lessened which also could imply more money on the sidelines available for investment.
Conclusion: The DecisionPoint postures are moving from neutral to somewhat bullish, mainly because of charts like the ones above. The Short-Term Trend Model (STTM) Neutral signals that were generated on the SPX and OEX this last week were quickly overridden by new STTM BUY signals. I'm not advocating a new bull market rush just yet, but I am pointing out that there are bullish indicators out there and we shouldn't ignore their input.
Come check out the DecisionPoint Report with Erin Heim on Wednesdays and Fridays at 7:00p EST, a fast-paced 30-minute review of the current markets mid-week and week-end. The archives and registration links are on the Homepage under “Webinars”.
Technical Analysis is a windsock, not a crystal ball.
Happy Charting!
- Erin
First, I'd like to invite everyone to join us via the internet for ChartCon 2016. It's only three weeks away and everyone here is growing very excited for this one-of-a-kind event. There will be tons of technically-oriented presentations from leading technical experts. You don't want to miss this! Be sure to register soon as ChartCon is rapidly approaching. There's an information page discussing the speakers, agenda, theme, etc. CHECK IT OUT HERE!!!
I'll be discussing repeating historical trends at ChartCon 2016, as well as participating on a panel discussion, so please join me for those. Along historical lines, September has been a very poor month for the S&P 500 over the past twenty years, as reflected below:
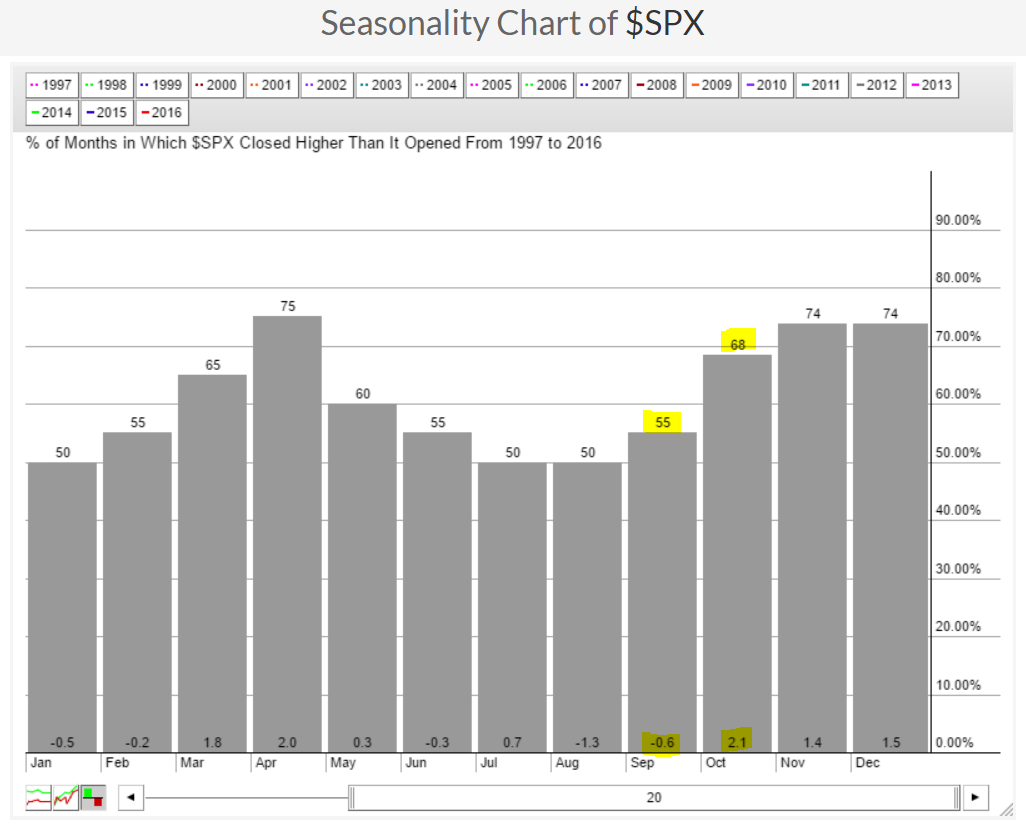 You can see that over the past twenty years, the S&P 500 has averaged a loss of 0.6% during the month of September. August is the only month that has produced worse results over the last two decades. While the above chart doesn't show it, September is the only calendar month since 1950 that has finished lower more than it's finished higher. And September has produced the worst calendar month results since 1950, bar none. Therefore, if U.S. equities are to rise this month, they'll have to do so vs. strong historical headwinds. Some have suggested that this historical pattern doesn't apply during presidential election years. I'll save my stats for ChartCon, but that is one piece of historical data that I'll address.
There's also the "Go away in May" crowd, which is the recognition that the November 1 to April 30 stock market performance is much stronger than the May 1 to October 31 performance. While this is true, you can see from the above chart that over the past twenty years, October has been the BEST calendar month in terms of average monthly gains. So this theory begs one very important question: Can you really afford to be out of stocks in October? I'll address the "Go away in May" theory and provide you my historical facts - when's the best time to be in and when's the worst time.
So given the historical weakness in September, should you simply sit this month out? I don't believe so. The historical facts are just that - historical facts. They don't provide us any guarantees. Furthermore, September doesn't experience losses every year, there's simply a stronger tendency to do so. Currently, we're in a bull market so "sitting out" is generally not a great idea. There have been pockets of industry strength during September over the past two decades and here's a sample of industry groups that have a very nice track record during this month:
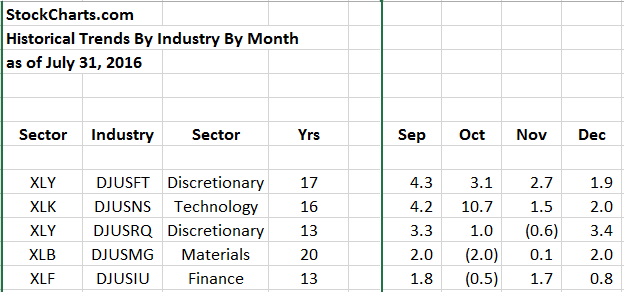 The footwear ($DJUSFT) and internet ($DJUSNS) groups really stand out to me as the best and second best industry groups during September. Obviously they've generated very solid average September returns over the past 17 and 16 years, respectively. Perhaps just as important, however, is that September strength is followed up by historical strength throughout the fourth quarter as well. For instance, the DJUSNS has averaged gaining 4.2% during the month of September, but has been scorching hot in October with average gains of 10.7%. The DJUSNS is one of the best looking areas of the market technically to boot. Check out this chart:
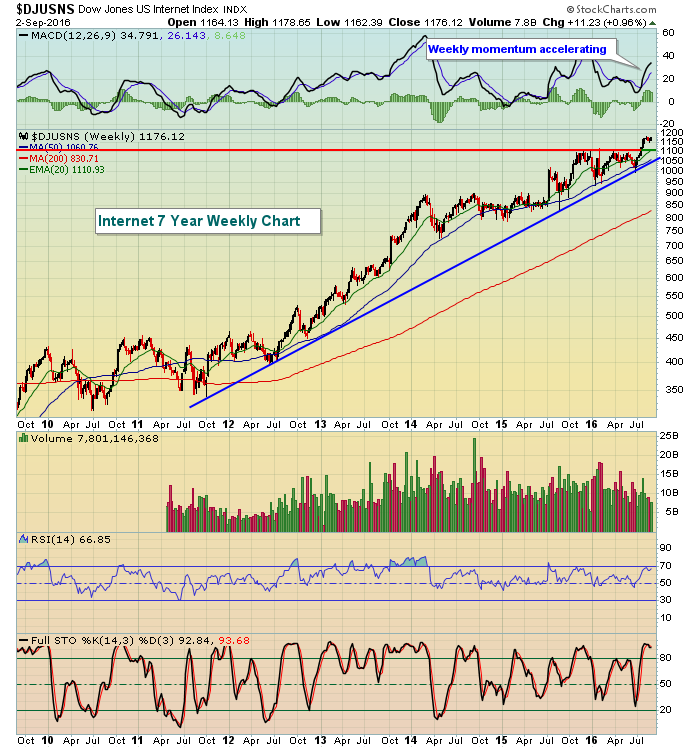 The seven year bull market has been very kind to internet stocks and other than being a tad overbought, there's not much here to argue with. I'd expect to see higher prices into year end. Significant price support resides near 1100 and trendline support is quickly approaching from underneath as well.
Happy trading and I hope you'll join us at ChartCon 2016!!!!
Tom
The market has been in consolidation mode for over six weeks now. The S&P closed at 2173 on July 20. It closed at 2179 on Friday. During that period of time any pullbacks have been shallow and short-lived with the S&P topping twice at 2193 and getting as low as 2157 on Thursday before roaring back on Friday to close back above all key moving averages. So on the surface, very bullish action; no one is really selling. Yet trying to trade successfully and make money during a flat market like we've experienced the past six weeks is a tricky proposition.
During this period of time I have urged members of EarningsBeats to be cautious and to allocate more of their capital to cash. Why? Because to me the reward to risk favors the bears, in spite of the stubbornness of the bulls. I might change my mind if the S&P clears 2193 because it would represent a new all time high and might spark renewed interest in stocks., But until that happens there's too much risk to the downside if all of the sudden traders decide in unison to unload their positions.
For those individuals who prefer to trade no matter the market conditions, it becomes important to zero in on those stocks that might stand out during a period of consolidation and hold up the best in the event of a sudden downturn. This is why we search for those companies that beat their earnings forecasts and have solid charts, the type of stocks traders will gravitate to if looking for some added safety.
As an example, we issued a trade alert to our members on August 11 on Cienna (CIEN) that beat earnings expectations and held nicely after an initial sell off after they reported their numbers. Our price target was $23.60 which is the exact level it touched on September 1. You can see in the chart below that CIEN held just fine even when the market did pull back, ultimately hitting our price target.
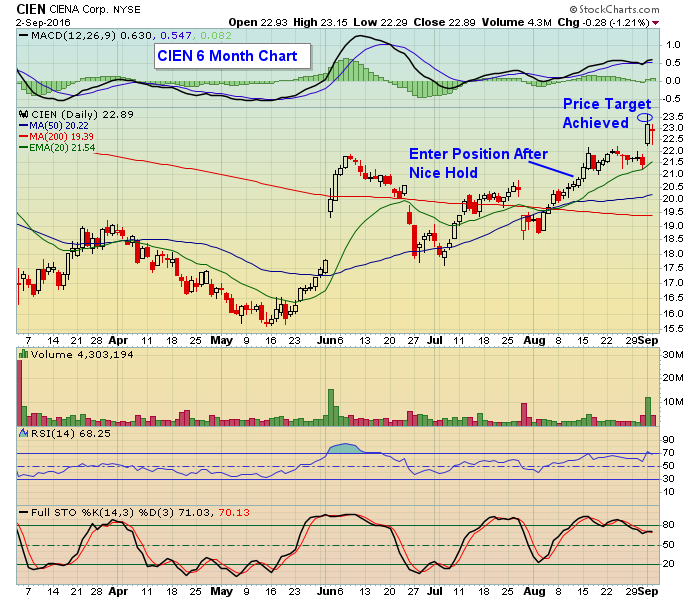 Obviously not every company that beats earnings expectations will outperform the market but it makes sense that traders would be interested in finding stocks that have solid fundamentals. And even better if there is a solid chart formation to back up those solid fundamentals.
As part of our service at EarningsBeats we conduct regular searches to find stocks that meet the specific criteria of beating earnings and have good looking charts. We provide stocks that make the cut to our members via our "Candidate Tracker" which includes annotated remarks so they can decide if they want to trade those stocks. Some end up as trade alerts like CIEN did. In fact, we've just added 100 new stocks to our Candidate Tracker and I am going to conduct a free Webinar this Wednesday, September 7 at 4:30 pm eastern. I will discuss the process of finding stocks that meet our criteria and will be joined by StockCharts.com Senior Technical Analyst Tom Bowley who will comment on some of the trading candidates. If you want to participate in this free Webinar just click here.
It's always easier to make successful trades when the market is on an upward trajectory; it's much trickier when the market is in consolidation mode. So you either need to move to the sidelines to preserve your capital or develop a different trading strategy so you can take advantage of those stocks that have greater upside potential, no matter the market conditions.
At your service,
John Hopkins
EarningsBeats

 As you hopefully know by now, ChartCon 2016 is right around the corner (Sept. 23rd & 24th) and things are really busy here as we prepare for our biggest conference ever. At this point we have over 800 people registered for the conference. That's almost triple the number that attended our previous conference! And registrations are still coming in - we hope to have over 1000 attendees registered by the time things get started on Friday, September 23rd.

 Emerging markets ended the week on a strong note. I keep reading that Chinese stocks have not participated in the EM rally. That may be true in Shanghai, but not in Hong Kong. The green line in Chart 2 shows Hong Kong iShares (EWH) ending the week at the highest level in two years. I recently suggested that a more stable Hong Kong dollar was attracting money (versus mainland stocks that are denominated in Chinese yuan). A more international audience and better liquidity is another factor. So is the fact that Hong Kong stocks yield more than 3.5% which makes them attractive for yield-chasing investors. I believe it's just a matter of time before mainland Chinese stocks start rising as well. The red line plots the CSI 300 China A-Shares ETF (ASHR) which just recently hit an eight-month high. Rising Chinese shares would also be good for emerging markets in general.


 The Bullish Percent Index (BPI's) are very strong. This is not an overbought condition. This is a very strong, broad, bullish setup. Usually, the Bullish Percents have to start making lower lows below 50 and then a lower high before the market struggles to make higher highs. Currently, the $BPNYA is still very strong. With the Percentage Of Stocks Above The 200 DMA ($NYA200R) in the lower panel showing a lot of strength, this is not the place where we usually collapse from.


 You can see that over the past twenty years, the S&P 500 has averaged a loss of 0.6% during the month of September. August is the only month that has produced worse results over the last two decades. While the above chart doesn't show it, September is the only calendar month since 1950 that has finished lower more than it's finished higher. And September has produced the worst calendar month results since 1950, bar none. Therefore, if U.S. equities are to rise this month, they'll have to do so vs. strong historical headwinds. Some have suggested that this historical pattern doesn't apply during presidential election years. I'll save my stats for ChartCon, but that is one piece of historical data that I'll address.
 The footwear ($DJUSFT) and internet ($DJUSNS) groups really stand out to me as the best and second best industry groups during September. Obviously they've generated very solid average September returns over the past 17 and 16 years, respectively. Perhaps just as important, however, is that September strength is followed up by historical strength throughout the fourth quarter as well. For instance, the DJUSNS has averaged gaining 4.2% during the month of September, but has been scorching hot in October with average gains of 10.7%. The DJUSNS is one of the best looking areas of the market technically to boot. Check out this chart:
 Obviously not every company that beats earnings expectations will outperform the market but it makes sense that traders would be interested in finding stocks that have solid fundamentals. And even better if there is a solid chart formation to back up those solid fundamentals.
 This "Charts I'm Stalking" blog is the second in a new series which will be a bi-weekly feature of The Traders Journal. I've decided to actually take it one step further than I initially explained in my